I’m a restorative dentist who got a hard wake-up call during the 2008 financial crisis. Since then, I’ve poured thousands of hours into understanding money, risk, and why costs keep rising in healthcare. I share the most useful, actionable resources I’ve found—especially for dentists, but helpful to anyone—so you can protect your financial health and your practice. That’s why I built The Bitcoin Dental Network. It’s free, practical, and no strings attached.
Article of the week for those feeling like their drinking from a financial firehose?
|
Hello Reader, Most dentists spend their careers wearing a dozen hats: clinician, CEO, CFO, HR director, marketer. But the one hat we were never trained for may be the most important of all: investor. Despite all that complexity, most of us share the same goal: run an excellence focused, patient centered, profitable practice and preserve the purchasing power of the profits we earn . This week’s Informationist newsletter from James Lavish does an excellent job explaining how financial markets behave during periods of stress when even “safe” assets can fall together, and how disciplined investors prepare rather than panic. Whether you’re an Owner Doc, Associate Doc, or valued member of the dental team, this is a worthwhile read. 💡When There's No Safe HavenIssue 208James Lavish, CFAMar 08, 2026∙ Paid ✌️ Welcome to the latest issue of The Informationist, the newsletter that makes you smarter in just a few minutes each week. 🙌 The Informationist takes one current event or complicated concept and simplifies it for you in bullet points and easy to understand text. 🫶 If this email was forwarded to you, then you have awesome friends, click below to join! 👉 And you can always check out the archives to read more of The Informationist. Today’s Bullets:
Inspirational Tweet:
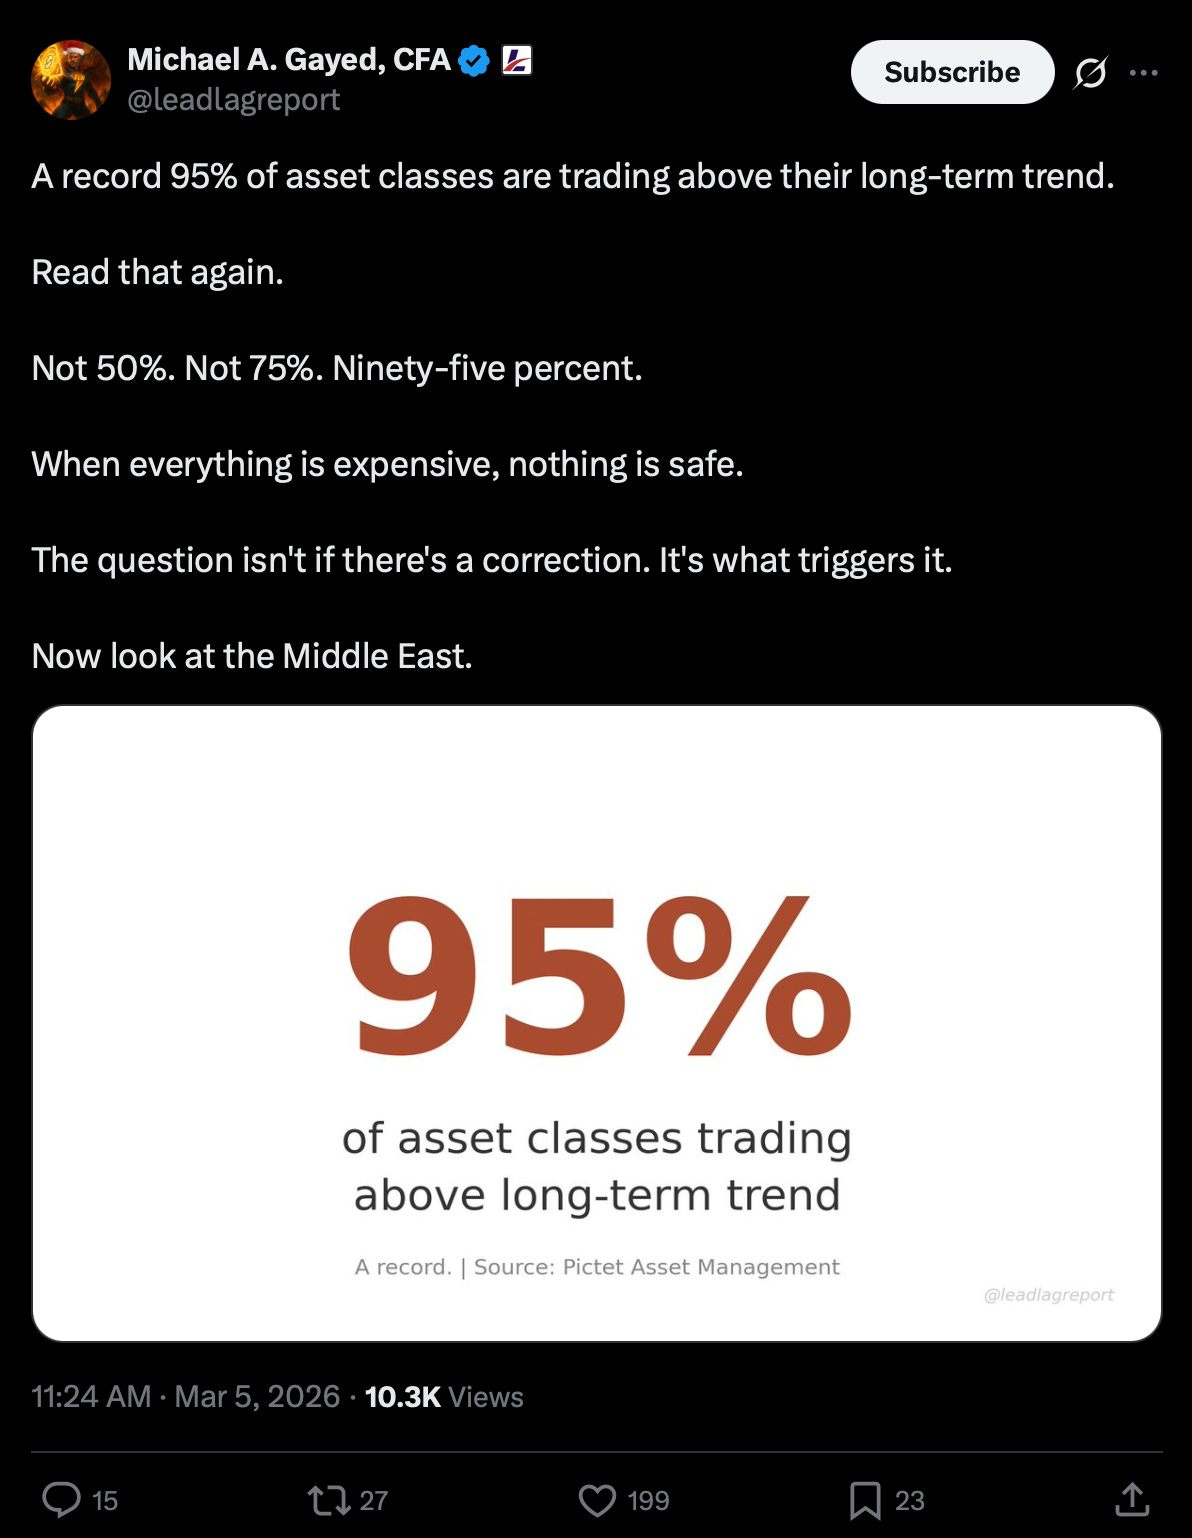
Let’s be honest. This tweet from Michael Gayed deserved a lot more than 10,000 views last week. Buried in a feed full of crude oil price and war-driven inflation worries, it was largely overlooked. But that other number is the one that stopped me cold. 95%. That’s how many asset classes are currently trading above their long-term trend. Not 50%. Not 75%. Ninety-five percent. A record. Think about that. If you own stocks, bonds, real estate, commodities, or crypto, odds are you’re sitting on positions that are allabove trend. At the same time. So what happens when something breaks and everything expensive starts selling at once? Does your diversified portfolio actually protect you? What’s the recovery playbook? All good questions, and ones we will answer, nice and easy as always, here today. So, pour yourself a big cup of coffee and settle into your favorite seat for a deep look at what happens when there’s no safe haven, with this Sunday’s Informationist. Partner spot.Most People Will Waste This Cycle
Bitcoin bear markets test your wits—and create opportunity for those prepared to act. Our new field guide, 21 Moves to Make in the Downturn, walks you through a clear, practical plan to steady your thinking, accumulate with discipline, and strengthen your long-term position while others lose focus. Inside, you’ll learn:
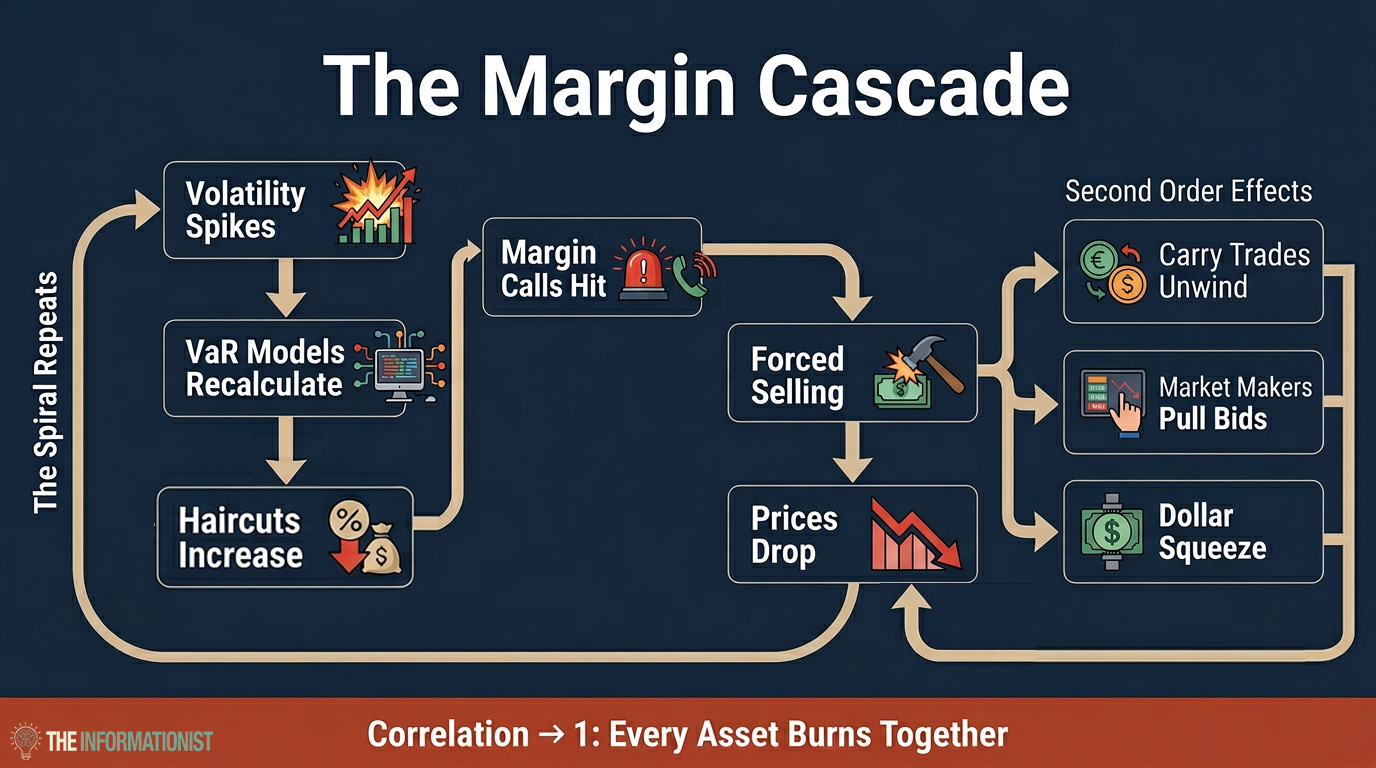
A small minority will quietly make the moves that matter. We wrote 21 Moves to Make in the Downturn for that minority. If you’re serious about building a position that survives the next decade, start here. ☎️ The Phone CallMarch 16, 2020. I’m sitting at my desk, coffee barely touched, scanning the pre-market numbers. Futures are limit down. Again. The S&P has already lost 20% in three weeks and the bleeding won’t stop. Then the email hits. Our prime broker’s normal morning operational summary lands in my inbox. But today, the subject line is anything but normal. “Immediate Margin Call Required.” All in red. I open it. Scan the margin summary first. Then the details. My stomach drops. A little background. Most individual investors use something called Reg T margin. It’s simple. Your broker lets you borrow roughly half the value of your stocks. You put up $100,000 | 1.49 BTC, you can buy $200,000 | 2.97 BTC worth. 2-to-1. Hedge funds play a different game. We use something called portfolio margining. Instead of a flat 2-to-1 rule, the broker looks at your entire book as one unit and assigns each position a haircut. Here’s how it works. A haircut is how much value the broker shaves off when calculating what you can borrow against. Blue chips in calm markets might get a 5% haircut. So if you own $100,000 | 1.49 BTC of Apple stock, you need at least $5,000 | 0.07 BTC of capital in your account against that position. Small number. Easy to cover. Riskier stocks get bigger haircuts. But when the whole portfolio is diversified, the math works in your favor. Instead of 2-to-1 leverage, you might get 5, 10 or even 20-to-1. Put up $100 million | 1,486 BTC, control over a billion in positions. Without derivatives. And if you have not worked in a hedge fund before, here is an important detail for you. All of those haircuts are set by a black box that sits on the prime broker’s risk desk. Not yours. Theirs. They decide, day to day and sometimes minute to minute, how your portfolio can be margined. How much you can borrow. How much collateral you need. And you agreed to it. Every hedge fund signs a portfolio margining agreement with their prime broker. You’re playing in their house, by their rules. Rules they can change whenever they want. When markets are calm, this works beautifully. The portfolio manager diversifies strategically, the black box sees low risk. The book gets small haircuts. Everyone’s happy. Until they aren’t. Because when volatility spikes, that black box recalculates. And when it recalculates, the prime broker doesn’t call to discuss it. They send you a notice. That’s what I was staring at. Virtually every micro-cap position in the fund had been raised to a 100% haircut. Overnight. Zero borrowing value. Those positions were now dead weight on the books. Regardless of how much confidence we had in them as companies, as far as the prime broker was concerned, they were dead weight. Even our best investments, the blue chip holdings in the eyes of the prime broker, you know, big S&P Mag 7 type stocks, had been raised from 5 or 6% to 25 or 30%. Overnight. One email. Every position. The entire margin structure of our fund had just been rewritten while we slept. And then you do the math in your head. You realize the cascade. Because it’s not just one position that’s underwater. It’s the whole book. Every holding now requires more collateral than it did yesterday. Collateral you don’t have. I pick up the phone and call the portfolio manager. Our chief investment officer. Possibly the worst phone call I’ve ever had to make in my career. This is where the hedge fund manager bypasses the portfolio managers and heads straight to the traders, telling them to sell. Ten percent. Twenty percent. Of everything. He doesn’t care what it is. “We need liquidity. We need it now.” The good positions. The bad positions. The hedges that were working perfectly. Didn’t matter. In these moments, you sell what you can, not what you want to. That’s what a correlation-to-1 event feels like from the inside. Like sprinting through a fire, every asset in your portfolio burning right alongside you. And yes, that means Treasuries too. All of it fair game. Everything on the cutting table. Because you just need one thing. Cash. Suddenly, a whole lot of it. That was March 2020. Fast forward to today. A record 95% of asset classes are trading above their long-term trend. And margin debt just hit an all-time high of $1.28 trillion | 19,020,447 BTC. The conditions are lining up again. So how does this actually happen? What breaks inside the plumbing that turns a normal selloff into a cascade where everything goes down together? Is there a pattern to the recovery? And what can you actually do to protect yourself before the next phone call comes? Let’s get into it. 🔧 The PlumbingSo you just read about what happened to one fund on one Monday morning. Now multiply that by a thousand. Because here’s the thing. Our fund wasn’t special. Pretty much every hedge fund, every leveraged institution, and every prime brokerage client received some version of that same email. A similar black box, running similar risk models, at every major bank on Wall Street, all recalculating at the same time. And they all reached the same conclusion: raise haircuts. Post haste. This is where a selloff becomes a cascade. Take a good look at this graphic of how it plays out. Take your time.
Let’s talk through it now, nice and easy. In normal markets, stocks and bonds behave differently. Stocks care about earnings and growth. Bonds care about interest rates and inflation. When stocks fall, investors rotate into bonds. Flight to safety. Your 60/40 portfolio works exactly as designed. But why does this happen? What triggers it? A simple reason behind a complicated number. Something called Value at Risk or VaR. VaR models use historical volatility, usually a rolling 30 or 60-day window, to estimate how much a portfolio could lose on any given day. When markets are calm, volatility is low. VaR is low. Haircuts stay small. Leverage stays high. Then volatility spikes. VaR explodes. The black box recalculates. Haircuts jump across every asset class simultaneously. And every fund on the street gets the same email we got. “Post more collateral. Today.” The data from March 2020 tells the story. Global futures margin requirements: Canada, TSX 60: up 326%. UK, FTSE 100: up 143%. US, S&P 500: up 143%. Triple the collateral. By end of day. Nobody has that kind of cash sitting around. So everybody sells. And that’s where the feedback loop kicks in. When everybody sells, prices drop. When prices drop, volatility increases. When volatility increases, VaR models spike higher. When VaR spikes, haircuts go up again. Now you need to sell even more. Brunnermeier and Pedersen, two of the leading researchers in market microstructure, have a name for this. They call it a liquidity spiral. Market liquidity disappears. Funding liquidity disappears. Each one feeds the other in a loop that accelerates until something breaks it. The technical term is procyclical margin requirements. The system tightens exactly when it needs to loosen. One more layer. In normal markets, firms like Citadel and Virtu are the ones providing liquidity. They’re the bid on the other side of your trade. They make markets. They keep spreads tight. They keep things orderly. These firms run risk models too. When their capital gets constrained, they pull their bids entirely. A study on the March 2020 crash found that when major market makers hit their own capital limits, liquidity evaporated in a coordinated fashion across global markets. Bid-ask spreads exploded. Some stocks couldn’t trade. Even Treasury bonds, the deepest and most liquid market on earth, went no-bid at times. Let me repeat that. US Treasuries. Went. No bid.
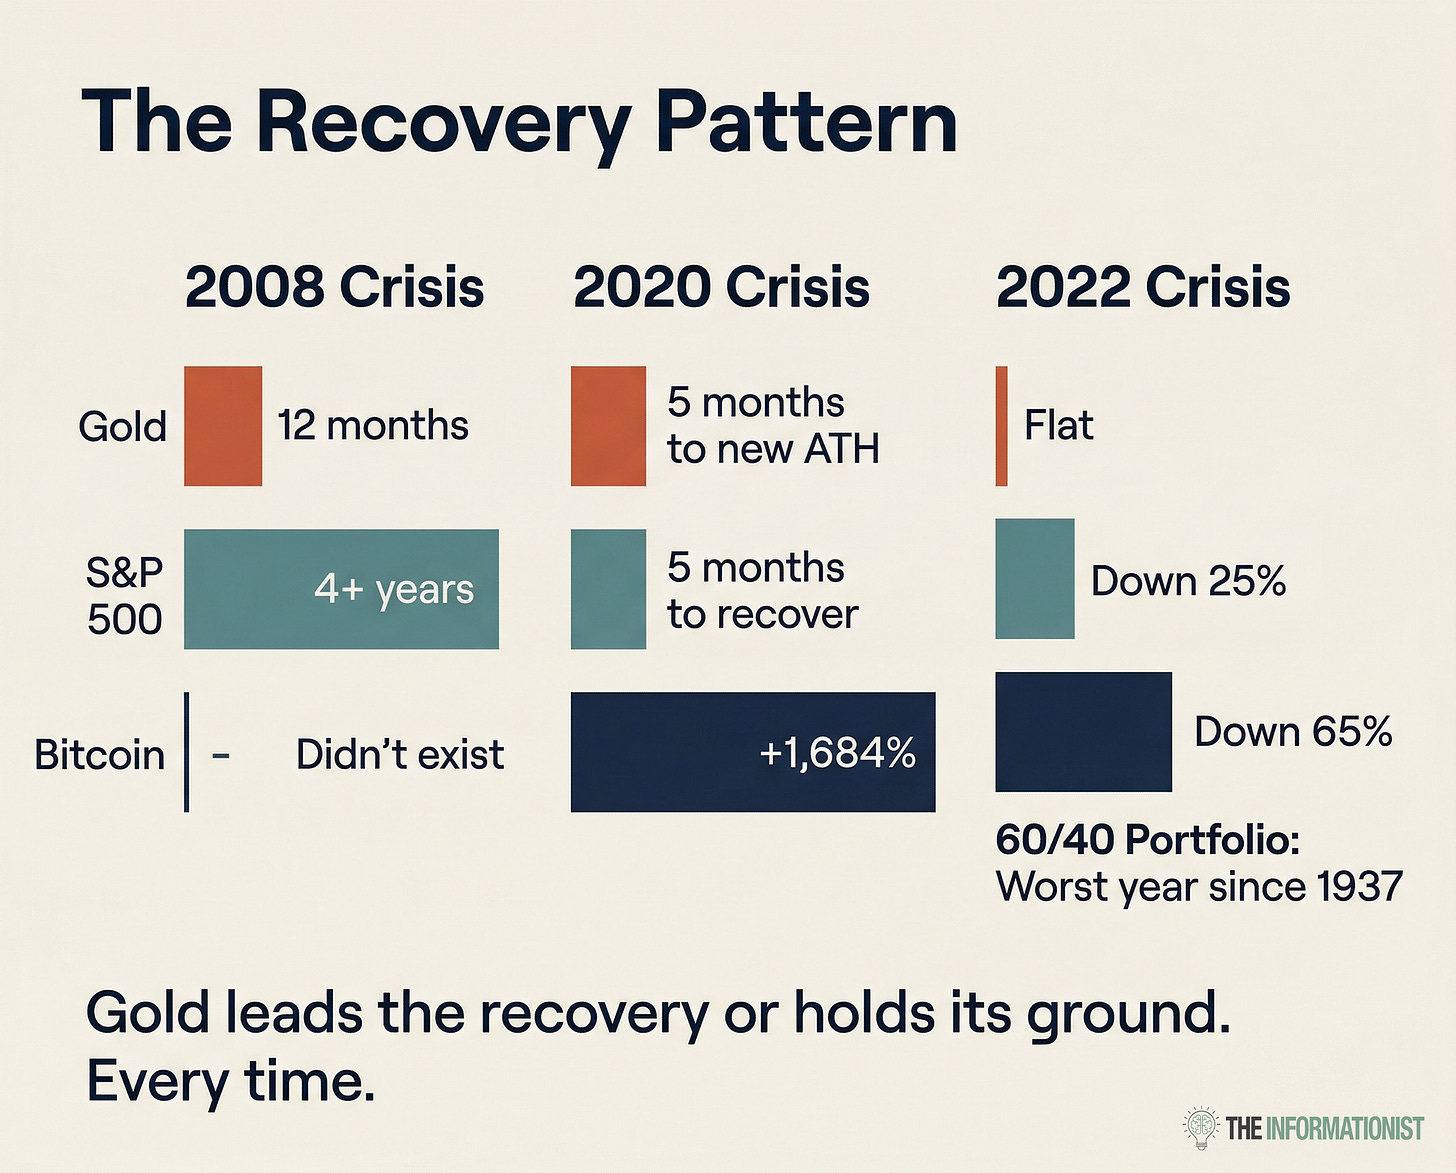
The people who provide liquidity needed liquidity themselves. So they stepped back. Sellers everywhere. Almost no buyers. And it spreads far beyond plain vanilla stocks and bonds. Every leveraged strategy in the global financial system faces the same margin call at the same time. Carry trades, where investors borrow in low-rate currencies like the Japanese yen to buy higher-yielding assets, start unwinding violently. We saw this in August 2024 when the yen carry trade rattled global markets. Interest rate arbitrage blows out. Credit spread positions get liquidated. Basis trades between futures and cash markets collapse. These are second and third-order effects. The initial margin call was on stocks. But the forced selling cascades into every corner of the financial system where someone borrowed money to make a bet. One final piece to this cascading puzzle. The entire global financial system runs on dollars. Debt is denominated in dollars. Margin calls come in dollars. Redemptions are in dollars. In a crisis, everyone needs dollars at the same time. So they sell everything to get them. Stocks. Bonds. Gold. Commodities. Foreign currencies. Anything that’s in the books, anything that they can get their hands on. Gold dropped 14% alongside stocks in March 2020. The ultimate safe haven got liquidated because investors needed the cash to cover margin calls on something else entirely. The margin models, the feedback loops, the liquidity withdrawal, and the global dollar squeeze all working together to turn an orderly selloff into a fire where every asset burns at the same time. 📊 The PatternOkay, so the plumbing breaks. Everything sells at once. Correlation goes to 1. Then what? Because correlation-to-1 events do end. They always end. The question is what happens next. And whether there’s something predictable about it. There is. Let me walk you through three examples. Watch what happens in each one. October 2008Lehman Brothers has collapsed. AIG just got bailed out. Money market funds broke the buck. The S&P 500 is in freefall and won’t stop falling until March of 2009. Gold gets crushed in the liquidation, too. Down more than 30% from its March peak. Same playbook we just talked about. Margin calls. Dollar squeeze. Sell everything. But gold bottoms on October 24, 2008. At $681 | 0.01 BTC an ounce. The S&P 500? Still falling. It won’t bottom for another four and a half months. March 9, 2009. At 676. Here’s the part that matters. Gold lost 30% in the crash. To recover that, it needed to climb about 48% from the bottom. Lo and behold, by late 2009, gold was back above $1,000 | 0.01 BTC. Fully recovered. The S&P lost 57% peak to trough. To recover that, it needed to climb 131%. That took over four years. The S&P didn’t get back to its pre-crash highs until March 2013. Gold recovered in one year. Stocks took four. And gold didn’t stop at recovery. By September 2011, it was at $1,900 | 0.03 BTC. Nearly double its pre-crash peak. Why? Because between the bottom and the recovery, the Fed did what the Fed always does in a crisis. They printed. Quantitative easing. Emergency lending facilities. Trillions of dollars flooding into the system. And where does all that new money go first? Into the asset with no counterparty risk. No earnings to disappoint. No debt to restructure. Gold. March 2020This one was different in timing but identical in sequence. Stocks, bonds, gold, Bitcoin. All bottomed the same week. March 23, 2020 for most assets. This was the ultimate dash for cash. Margin calls everywhere. Prime brokers raising haircuts 300% in a week. The cascade we just described. Everything sold together. Correlation-to-1 in its purest form. But watch the recovery. By August 2020, just five months later, gold hit new all-time highs above $2,075 | 0.03 BTC. The S&P 500 was still climbing back toward its February peak. Gold got there first. Again. And what did the Fed do between March and August? The same thing they did in 2008. Emergency rate cuts to zero. Unlimited QE. Trillions in new liquidity. The money printer turned on. Gold led. This is where it gets interesting. Bitcoin bottomed at around $5,000 | 0.07 BTC in March 2020. By December, it was at $29,000 | 0.43 BTC. By November 2021, it touched $69,000 | 1.03 BTC. Gold led the recovery. Bitcoin eventually overtook it by a mile. More than 10x in under two years from its crisis low. The sequence matters. Gold moves first because institutions trust it. Central banks hold it. It’s the oldest safe haven in existence. When the Fed starts printing, gold is the first hard asset to catch a bid. Bitcoin moves second. And when it moves, it moves violently. Because Bitcoin is a harder asset than gold with a fixed supply and no central bank can print more of it. Once the liquidity wave reaches crypto, the upside dwarfs everything else. And in 2022This one is the outlier. And it’s important because it shows what happens when the enemy is different. In 2008 and 2020, the crisis was credit and liquidity. The Fed’s response was simple: cut rates, print money, flood the system. In 2022, the enemy was inflation. And the Fed had to fight it by hiking rates from 0% to 4.5% in one year. Stocks fell 25%. Normal for a hiking cycle. But bonds fell 13% too. The classic 60/40 portfolio lost 17.5% in 2022. The worst year since 1937. Eighty-five years. Bonds were supposed to protect you. They were supposed to be the ballast. But when the Fed is hiking aggressively, both stocks and bonds get repriced lower. Your diversification only works when the risks are different. In 2022, the risk was the same for both: rising rates. And gold? Stayed roughly flat. Didn’t make money. Didn’t lose it either. Just sat there while 60/40 investors watched decades of portfolio theory fall apart. Being boring was the best trade of 2022. Before we continue, a word of caution. Gold is near all-time highs as I write this. More than double in two years. Central banks buying at record pace. The safe haven trade is well underway. The pattern still holds. Gold leads recoveries. But the asymmetric opportunity in the next correlation-to-1 event may not be gold at $5,170 | 0.08 BTC. It may be somewhere else entirely. So what’s the pattern? Three crises. Three different triggers. One consistent signal.
Gold either leads the recovery or holds its ground while everything else falls apart. Every single time. In liquidity crises (2008, 2020), gold bottoms first, then stocks follow months later. The Fed prints money, gold catches the first wave, and something else slingshots past everything. In structural repricing (2022), gold holds flat while the traditional portfolio gets destroyed. The recovery sequence is real. And it starts with the one asset that has no counterparty, no earnings risk, and no central bank that can dilute it overnight. OK great, we now see the pattern, but what can we actually do with it? 🎯 The PlaybookIf you’ve made it this far, you understand the mechanics. You know how the plumbing breaks. You know the pattern. Now the question is what to do about it. I’m going to walk through three levels of preparation. They go from simple to increasingly complex. If you’re newer to investing, the first level may be all you need. If you’re more experienced and comfortable with options and hedging strategies, the third level gets into some of the tools I might discuss with sophisticated investors depending on their individual situation. Remember, none of this is personal investment advice. Every portfolio is different. But these are the frameworks I think about when I see conditions like the ones we’re looking at right now. Level 1: Build the FoundationThe single most important thing you can do before a correlation-to-1 event is the simplest. Raise cash. I’m talking 20 to 30% of your portfolio sitting in money market funds or short-term T-bills, earning yield while you wait. The point of this is not to time the market, but rather to give yourself options. Because here’s what happens in a correlation-to-1 event. Prices get stupid. Companies worth $100 billion | 1,485,972 BTC trade like they’re worth $60 billion | 891,583 BTC. Good businesses, strong balance sheets, growing earnings. Selling at a 40% discount because some way over-levered hedge fund had to meet a margin call. Cash is what lets you buy those opportunities. Without it, you’re watching from the sidelines. Or worse, you’re the one selling. The other thing? Stop checking your portfolio every hour. If you have a 10-year time horizon, a correlation-to-1 event is noise. The S&P dropped 57% in 2008. It recovered. It dropped 34% in 2020. It recovered in five months. The biggest mistake I see from newer investors is selling at the bottom to stop the bleeding. That’s when you lock in the loss permanently. Correlation-to-1 is temporary. It always has been. Ultimately, the recovery is where the money is made. Level 2: Position for the TurnIf you’re comfortable managing a more active portfolio, there are a few things I’d consider in an environment like this. First, take a hard look at concentration. If any single position is 15 or 20% of your portfolio, that’s a risk in a correlation-to-1 event. When margin calls hit, the biggest positions get the biggest haircuts. Trimming concentration now gives you flexibility later. Second, think about laddering T-bills. Not just cash, but locked-in cash at current rates. Buy a mix of 3-month, 6-month, and 1-year maturities. If the Fed cuts rates during a crisis, your 3.75% T-bills suddenly look very attractive. And they mature on a schedule, giving you dry powder to deploy at specific intervals. Then look at what you own. There’s a difference between holding an index fund of large-cap companies with strong balance sheets and holding a basket of speculative growth names with no earnings. In a correlation-to-1 event, both get hit. But only one recovers quickly. If your portfolio is heavy on speculative names, this is a good time to rotate toward quality. Companies with net cash, steady free cash flow, and pricing power. They get sold in the panic just like everything else. But they bounce back first because the fundamentals were never broken. Third, write down your buy levels. Right now. Before emotions take over. “If the S&P drops to X, I deploy Y dollars.” “If gold pulls back to Z, I add this much.” Write it down and tape it to your monitor. When the cascade happens, you will be thinking clearly when nobody else is. This removes the emotion and keeps you from changing the plan mid-stream, trying to stick the landing and catch the bottoming perfectly. We call this ‘getting cute’ in the business. Don’t do that. Level 3: The Asymmetric SetupThis is where it gets more complex. What I’m about to describe involves options and hedging strategies that require experience and a clear understanding of the risks involved. This is the kind of approach I might walk through with a sophisticated investor who has the risk tolerance and the capital to execute it. The idea is simple even if the execution requires some work. You want to set up a position that profits from a drawdown and then use those profits to fund your recovery trades. Here’s one example. SPY put spreads. Buy a SPY put at a strike roughly 5% below current levels, and sell a put about 10 to 12% below current levels. Same expiration. 60 to 90 days out. Why the $640 | 951,022 sats strike? Because we’re not hedging against a normal pullback. A 3 or 4% dip is just market noise. We’re hedging against a correlation-to-1 event. The kind that drops markets 10 to 15% in a matter of days. Buying the put 5% below current levels keeps the premium affordable. Think of it like a deductible on an insurance policy. You absorb the first 5%. The policy kicks in after that. As of this writing, with the S&P 500 at roughly 672, here’s what that looks like.
The most you can lose is the premium you paid. Defined risk. If the market stays flat or goes up, you lose that $750 | 0.01 BTC and move on. Cost of insurance. Simple as that. But if the S&P drops below $590 | 876,724 sats, the spread pays out its full value of $50 | 74,299 sats per share. Net of what you paid, that’s about $42.50 | 63,154 sats, or roughly a 5.5-to-1 return on your money. And with the cost of this spread at $750 | 0.01 BTC per contract, the math only needs to work once every few years to pay for itself many times over. You close it. Take the profit. Combine it with the cash you’ve been sitting on. Suddenly you have significantly more dry powder to deploy into a market that’s been beaten down by forced selling. You’re buying assets at prices driven by margin calls, not fundamentals. And the pattern from the previous section becomes your edge. Watch gold. When gold starts turning green while stocks are still red, correlation-to-1 is breaking. The plumbing is healing. Liquidity is coming back. That’s your signal to start deploying. And remember what we said about the recovery sequence. Gold leads. Stocks follow. And then there’s that other asset. The one that went from $5,000 | 0.07 BTC to $69,000 | 1.03 BTC in under two years after the last correlation-to-1 event. Bitcoin. In a correlation-to-1 event, I expect Bitcoin to get hit as hard as anything. Maybe harder. It’s acted as a risk asset for years now, trades 24/7, and it’s the easiest thing to sell at 3 AM or on a weekend when you need cash. But once the Fed responds, once the liquidity spigot opens, Bitcoin has historically delivered the most explosive recovery of any major asset. Fixed supply. No central bank can print more of it. And in a world where the Fed’s playbook is always the same, print and hope, that scarcity matters more than ever. The asymmetric setup is this: protect your downside with defined-risk hedges → accumulate cash → wait for the flush → watch gold for the turn → and deploy into the assets with the highest convexity on the recovery If the event happens, you’re positioned. If it doesn’t, you’ve lost a small premium on your hedges and your cash earned 3.5 to 4%. That’s the playbook. ─── 👀 What I’m Watching This Week📌 The Number: $1.28 trillion | 19,020,447 BTC. That’s total US margin debt as of January 2026. All-time high. 36% higher than a year ago. (FINRA) 📌 Put-call skew on the S&P 500 is in the 96th percentile, highest since the 2022 bear market. Institutions are already hedging. 📌 Gold at $5,170 | 0.08 BTC. If it breaks above $5,500 | 0.08 BTC with conviction, the institutional rotation into hard assets is accelerating. 📌 VIX above 27. Watch for a sustained move above 30. That’s historically where the plumbing starts to crack. 📌 CPI on March 11, FOMC on March 18. Two catalysts that could move everything in the same direction. ─── That’s it. I hope you feel a little bit smarter knowing about correlation-to-1 events and how to prepare for them. If you enjoyed this newsletter, please share it with someone who you think will love it, too! Talk soon, James ✌️ As always, my goal with the Bitcoin Dental Network is not to add to the noise, but to help filter it. There is an overwhelming amount of financial information out there, and I spend time each week reviewing hundreds of sources so you don’t have to drink from another firehose. If you find this helpful, I’d genuinely welcome your feedback. And if you’re interested in exploring more curated resources on money, markets, and Bitcoin, please visit TheBitcoinDentalNetwork.com. Thanks for reading, and for being part of the conversation. Mark R. Link D.D.S. (Founder of The Bitcoin Dental Network) |

The Bitcoin Dental Network
I’m a restorative dentist who got a hard wake-up call during the 2008 financial crisis. Since then, I’ve poured thousands of hours into understanding money, risk, and why costs keep rising in healthcare. I share the most useful, actionable resources I’ve found—especially for dentists, but helpful to anyone—so you can protect your financial health and your practice. That’s why I built The Bitcoin Dental Network. It’s free, practical, and no strings attached.
Hello Reader, Many of you have already heard me talk about the financial “baptism by fire” Jean and I went through in 2008, when the monetary system suddenly stopped feeling abstract and became very personal. That experience is a big part of why articles like this one from Jordi Visser still grab my attention today. In this week’s Article of the Week, Jordi lays out a compelling framework for understanding the economic pressures building beneath the surface—debt, oil, slowing growth, and...
Hello Reader, There is, in my opinion, a nauseating amount of attention paid to Bitcoin’s price. And honestly, it’s hard to get away from it. Whether it’s pundits explaining the latest dump, perma-bulls calling for million-dollar Bitcoin, theories about Jane Street manipulation, chatter about ETFs and treasury companies “pumping our bags,” or endless arguments about the four-year cycle, the noise is constant. And it is noise. Inside and outside the Bitcoin world, many have lost sight of...
Hello Reader, Many of you read Sunday’s Article of the Week on the growing risks inside the private credit market. If that piece gave you a sense that something beneath the surface isn’t quite right… this week’s Video of the Week will take that feeling and sharpen it into clarity. In this conversation, Tom Bilyeu walks through the structural parallels between today’s private credit system and the mechanics that led to the 2008 financial crisis; connecting dots in a way that’s both sobering...