I’m a restorative dentist who got a hard wake-up call during the 2008 financial crisis. Since then, I’ve poured thousands of hours into understanding money, risk, and why costs keep rising in healthcare. I share the most useful, actionable resources I’ve found—especially for dentists, but helpful to anyone—so you can protect your financial health and your practice. That’s why I built The Bitcoin Dental Network. It’s free, practical, and no strings attached.
Resending: The 6% Club
|
Hello Reader, Most people focus on the size of the U.S. debt. But as James Lavish explains in this week’s Informationist, the more important number isn’t the debt itself; it’s the speed at which it’s growing. He calls it the “Dubious 6% Club,” and it refers to something historically reserved for wars and financial crises: deficits above 6% of GDP. The difference today? There is no declared crisis. Below is his clear, data-driven breakdown of what that means, why the math matters, and how it ultimately impacts your savings, retirement, and purchasing power. 💡 The Dubious 6% ClubIssue 206James Lavish, CFAFeb 22, 2026∙ Paid ✌️ Welcome to the latest issue of The Informationist, the newsletter that makes you smarter in just a few minutes each week. 🙌 The Informationist takes one current event or complicated concept and simplifies it for you in bullet points and easy to understand text. 🫶 If this email was forwarded to you, then you have awesome friends, click below to join! 👉 And you can always check out the archives to read more of The Informationist. Today’s Bullets:
Inspirational Tweet:
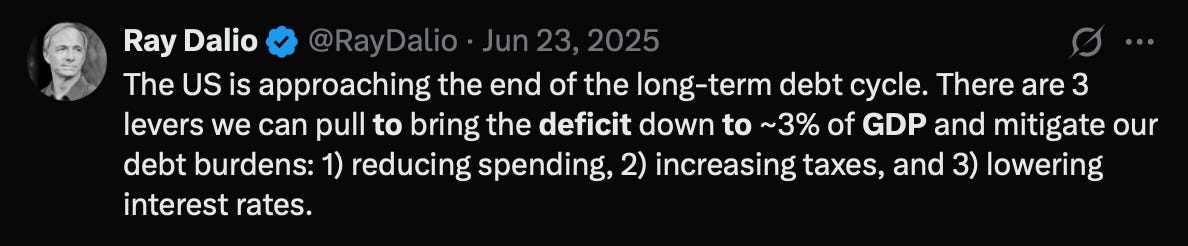
Ray Dalio has been talking about something that should honestly be getting a lot more attention than it has recently. He laid out a simple target. A number that the US deficit needs to hit to avoid what he calls a debt crisis. And then he listed three levers that could get us there. Simple enough. Except for one problem. When you look at where that number actually is right now, and where it’s headed, you realize those three levers will not be enough.In fact, it’s not even close. And the consequences of that? They touch everything. Your savings. Your mortgage. Your retirement. And if you’re still trying to build those things? It matters even more. And this morning’s GDP report? It just made the matheven harder. So what is Dalio’s target? What’s the number everyone should actually be watching? And what does all of this mean for the US dollar and your money? All great questions that deserve serious consideration and answers, ones that we will sift through, nice and easy as always, here today. So pour yourself a big cup of coffee and settle into your favorite seat for a look at the number that nobody’s watching closely enough with this Sunday’s Informationist. Partner spot
The cracks in the foundations of money are becoming harder to ignore. Persistent deficits, rising debt, and central bank behavior are quietly reshaping how investors think about preservation and risk.
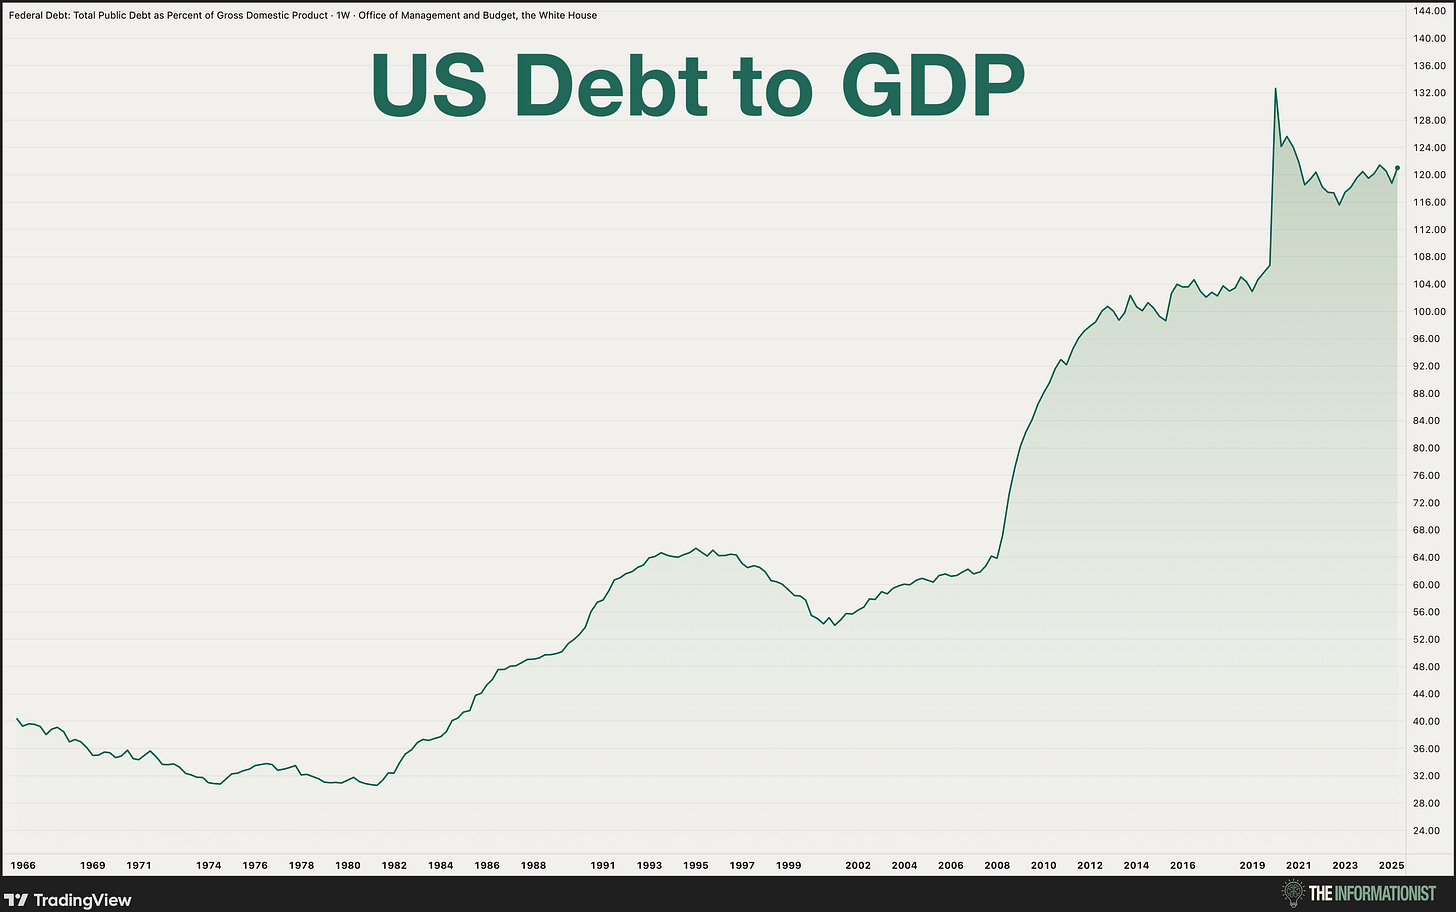
You can download the report here: Download 🫣 The Number Behind the NumberYou’ve probably seen the charts. US national debt held by the public just crossed $32 trillion | 475,059,382 BTC. That’s about 100% of GDP. The total including intergovernmental holdings? $38.6 trillion | 573,040,380 BTC. Big numbers. Scary numbers. And they get a lot of attention.
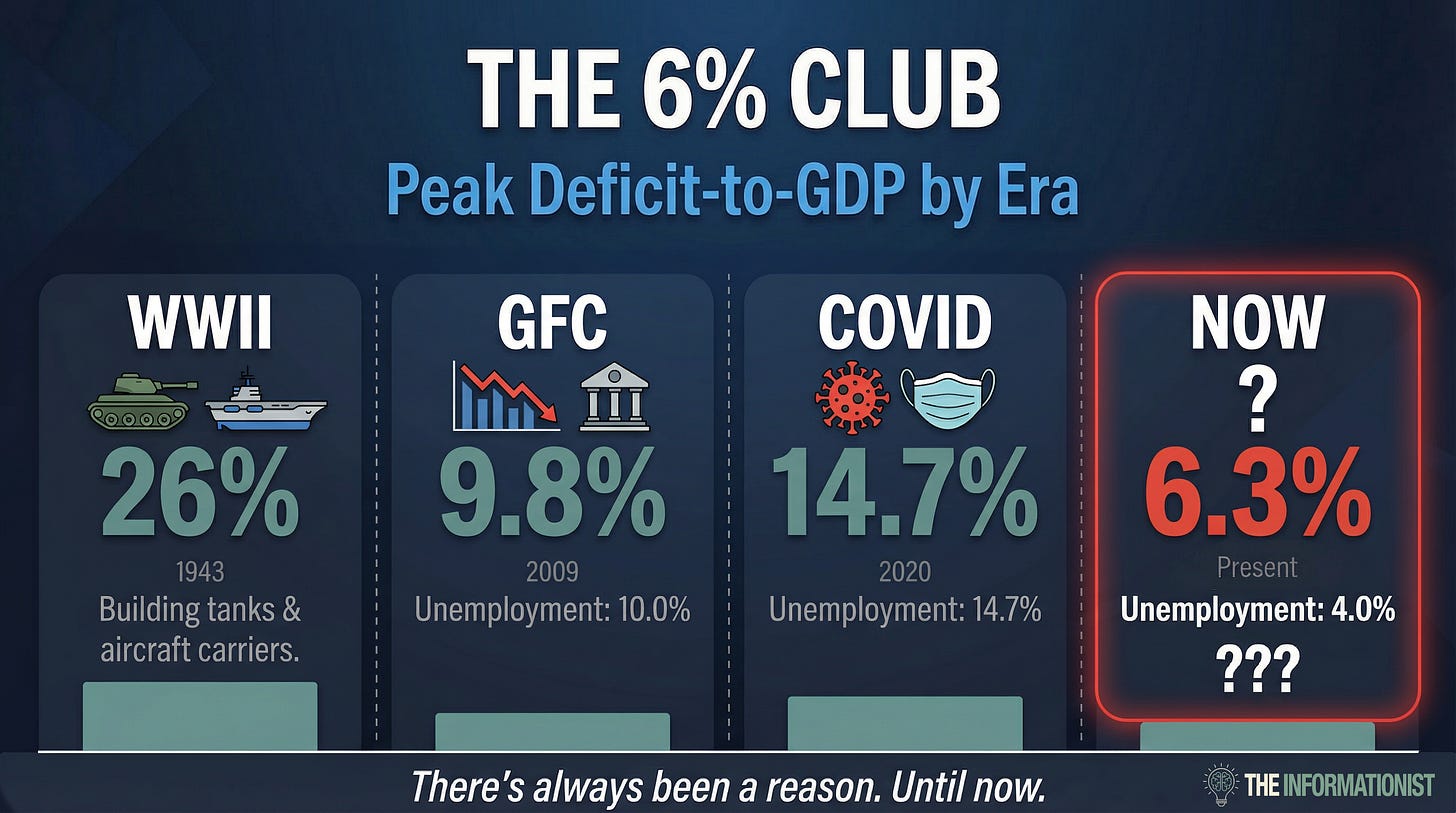
And by the way, even that $38.6 trillion | 573,040,380 BTC actually, severely understates the problem. When you add in unfunded liabilities for Social Security, Medicare, and Medicaid, the total obligation is over $175 trillion | 2,597,980,998 BTC. The real mountain of debt may be more than four times what we’re counting. But there’s a number behind that number. One that tells a much more urgent story. Let me explain. Debt-to-GDP tells you the size of the pile. How much has accumulated over the years. And yes, it’s a big pile. But it’s a snapshot. It tells you where you are at one moment in time. What it doesn’t tell you is how fast the pile is growing. Whether it’s accelerating or slowing down. Whether the trajectory is getting better or worse. For that, you need the deficit. Specifically, the deficit as a percentage of GDP. Think about it like your credit card statement. The balance is what you owe. A big balance is bad, but what really tells you if you’re in trouble? The monthly charges. How much *new* debt you’re adding each month relative to your income. Or think of it like this: The debt is the odometer, which tells you how far you’ve driven. The deficit is the speedometer. It tells you how fast you’re going right now. And right now, the speedometer is pinned. The US ran a $1.83 trillion | 27,167,458 BTC deficit in fiscal year 2024. That’s 6.3% of GDP. Fiscal year 2025 came in at $1.78 trillion | 26,425,178 BTC. About 5.8%. And fiscal 2023? 6.2%. Three straight years at or near 6%. Double Ray Dalio’s target. The 50-year average? 3.8%. We’re running at more than 150% of the historical norm. Now, you might be thinking, “OK, that sounds bad, but hasn’t the US run big deficits before?” Yes it has. But never like this. And to show you what I mean, let me introduce you to what we call the 6% Club. ♣ 6% Club: The Club You Don’t Want to JoinIn the entire post-WWII era, the United States has run deficits above 6% of GDP in only a handful of years. Every single time, there was a reason. World War II. We were fighting for the survival of the free world. Deficits hit 26% of GDP in1943. But we were building tanks and aircraft carriers and funding a massive global military operation. When the war ended? Deficits snapped back immediately. The Global Financial Crisis. The banking system was collapsing. Millions of Americans were losing their homes. Unemployment hit 10%. The deficit spiked to 9.8% in 2009 and stayed above 6% through 2012 as the government pumped trillions into the economy to keep it from going under. COVID. The world economy shut down overnight. Unemployment hit 14.7% in a single month. Congress authorized trillions in emergency spending. The deficit hit 14.7% of GDP in 2020. Every time, the pattern was the same. Crisis hits → Deficit spikes → Crisis passes → Deficit comes back down Until now.
From 2023 through 2025, the US has run three consecutive years at or near 6% of GDP in deficits. And here’s the part that worries me the most. Unemployment is 4%. GDP grew 2.25% last year. The stock market is near all-time highs. There is no war. There is no financial meltdown. There is no pandemic. We are running crisis-level deficits without a crisis. That has never happened before. Not during Vietnam. Not during the Reagan defense buildup, which topped out at 5.9% and had people screaming about fiscal recklessness. Not during the dot-com bust. Never. And as this is not a temporary spike caused by some one-time emergency, it can only mean one thing. This is structural. Social Security. Medicare. Medicaid. Veterans benefits. Interest on the debt. These are the big five, and they’re written into law. They grow automatically every year. Together, they now consume about 75% of the entire federal budget before Congress even shows up to work. Add in defense, and you’re at 87%. Then add net interest on the debt, now running at nearly $1 trillion | 14,845,606 BTC a year, and you’re over 100% of tax revenue. That leaves nothing for everything else. Every federal agency. Every program. Every grant. Every national park, every food inspector, every air traffic controller. The government is already borrowing just to keep the lights on. For anyone hoping the numbers get better from here, they don’t. The CBO just released updated projections this month. All 172 pages of them. They expect the deficit to grow from 5.8% of GDP in 2026 to 6.7% by 2036. In dollar terms, that’s $1.85 trillion | 27,464,371 BTC this year rising to $3.1 trillion | 46,021,378 BTC in 2036. Oh, and their track record on these projections? Let’s put it this way, at least Punxsutawney Phil has a 50% chance of being right on Groundhog Day. The CBO is nowhere near that. For instance, last year they forecast $21.8 trillion | 323,634,204 BTC in cumulative deficits over the next decade. This year’s update? $23.1 trillion | 342,933,492 BTC.
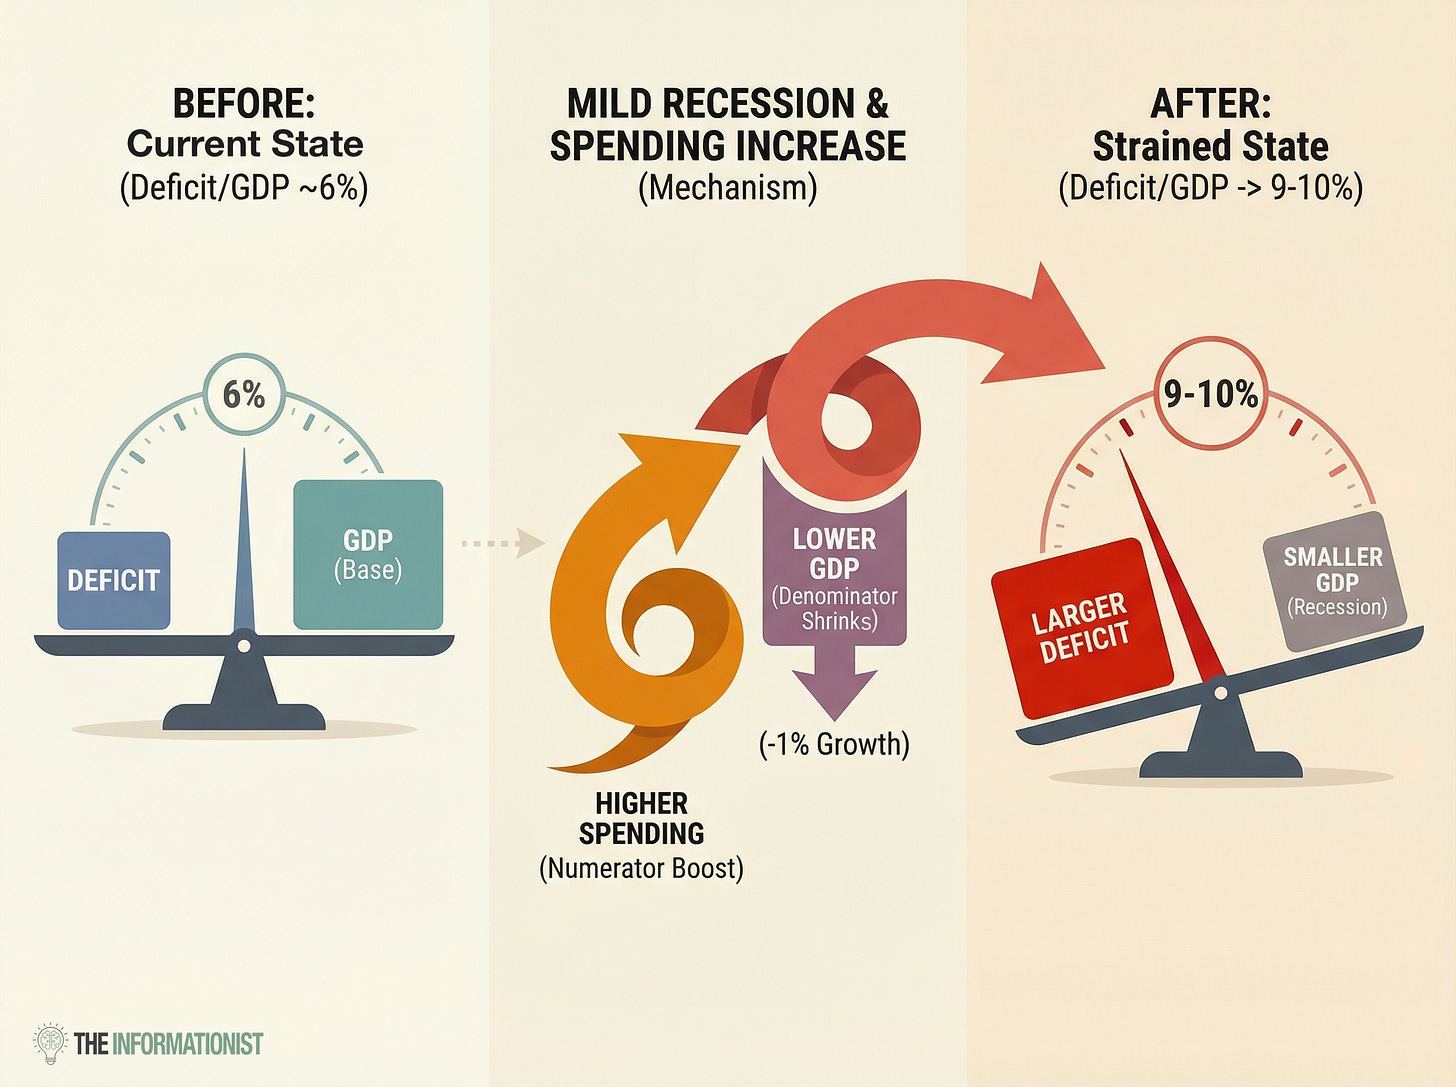
Good Lord. The projection got $1.4 trillion | 20,783,848 BTC worse. In twelve months. Oh, and the CBO assumes no recessions. For the entire projection window. A full decade of uninterrupted growth. Exactly. We have never gone a full decade without a recession in the modern era. Absurd would be putting it lightly. 😵💫 A Doom Loop UpdateSpeaking of Groundhog Day, if this feels familiar, it should. Some of you are well aware that I wrote about the US debt spiral nearly three years ago. Back then, interest expense was $400 billion | 5,938,242 BTC and the coverage ratio was already below 1x. Today it’s over $1 trillion | 14,845,606 BTC. But here’s where the math gets really ugly. Net interest on the federal debt hit $970 billion | 14,400,238 BTC in fiscal year 2025. That’s 3.2% of GDP. On interest. To put that in perspective, the entire defense budget is $885 billion | 13,138,361 BTC. The US government now spends more money paying interest on its past borrowing than it does funding the military. And the CBO says it’s heading to $2.1 trillion | 31,175,772 BTC by 2036. That’s 4.6% of GDP. More than double what it is today. And the detail that really tells the story? The CBO projects that the primary deficit, which is the deficit without interest, actually improves over the next decade. Falls from 2.6% of GDP to 2.1%. In other words, the CBO projects that the government is slowly getting its non-interest spending closer to in line with revenue. Even if they’re right (I would argue they aren’t), it doesn’t matter. Why? Because interest expense is growing so fast, it swallows any and all projected progress. The total deficit gets worse even as the operational deficit gets better. That’s the doom loop. For those of you who have not heard me speak about this before, you may be asking, So how did we get here? And why can’t we stop it? A quick refresher on how the doom loop works. The government runs a deficit. To cover that deficit, it borrows money by issuing Treasury bonds. Those bonds carry interest. That interest becomes a new expense in next year’s budget. That expense makes the deficit bigger. A bigger deficit means more borrowing. More borrowing means more interest. Around and around it goes. Deficit → Debt → Interest → Bigger Deficit → More Debt → More Interest And every 100 basis points of higher interest rates adds roughly $290 billion | 4,305,226 BTC per year to the bill. So if rates stay elevated, or if the bond market demands higher yields to absorb all that new issuance, the spiral picks up speed. And this is why the administration is demanding the Fed lower rates. Hint: As much as they claim that it’s about your mortgage rate, it’s not. It’s really about interest on federal debt. Cue up last week’s GDP report. Q4 growth came in at 1.4%. The consensus expected 3%. Last quarter was 4.4%. That’s a sharp deceleration. And it matters because deficit-to-GDP is a fraction. A numerator and a denominator. I know, I know, math. But stay with me here, it’s actually quite simple. The numerator is the deficit. $1.8 trillion | 26,722,090 BTC and climbing. It’s structural. Mandatory spending. Entitlements. Interest payments. These don’t shrink when the economy slows. They grow. The denominator is GDP. The total output of the economy. When the top stays high and the bottom slows down, the ratio gets worse. Quickly. And if the economy actually contracts? We don’t have to imagine that. It happened in Q1 of this past year, when GDP shrank 0.6%. In a contraction, you get hit from both sides. Tax revenues fall because people and companies are earning less. Spending rises because unemployment benefits and other automatic stabilizers kick in. The deficit gets bigger. GDP gets smaller. The ratio doesn’t just worsen. It explodes. During the GFC, the deficit went from 1.1% of GDP in 2007 to 9.8% in 2009. In two years. COVID was even faster. From 4.6% to 14.7% in a single year. If we’re already starting from 6%, where do we end up after the next recession? 10%? 12%? The math gets absolutely brutal, almost instantly.
And then there’s the wildcard that the experts are debating, but nobody seems to be able to pin down. The impact of artificial intelligence on the economy. The reality is that nobody knows exactly how this plays out. But we do know that AI is growing and being enhanced rapidly. Even faster than many people expected. Because here’s the thing. AI is structurally disinflationary, if not deflationary. It puts pressure on employment and wages. It drives productivity higher while pushing the cost of goods and services lower. That’s great for consumers. But nominal GDP (total GDP not adjusted for inflation) could slow even as real output holds steady. And nominal GDP is what the ratio uses as its denominator. In other words, the technology that so many are celebrating as the next great growth engine could make the fiscal math worse. And the need for money printing to manage this growing debt problem doesn’t go away. It just gets amplified. 🪙 What It Means for Your MoneySo we’re in the 6% Club with no crisis to blame. Interest is compounding. The denominator is weakening. And the CBO says it’s only getting worse from here. Now what? Let’s go back to Ray Dalio’s three levers. He says we need to get to 3% of GDP. Cut spending. Raise taxes. Lower rates. For those of you who read my piece on Trump’s new Fed Chair just a few weeks ago, you already know where this is going.For those of you who have not read that piece or just want to revisit it, you can find that here:
James Lavish, CFA·Feb 1Read full story In essence, it’s all about The Four Doors.
Which leaves door number four. The one they always choose. Debase the currency. Not with an announcement. Not with a policy paper. No, no. You boil the frog nice and slow. Let inflation run a little hotter than it should. Keep rates a little lower than they need to be. Let the real value of the debt erode, slowly, over time. The debt doesn’t shrink in dollar terms. It shrinks in terms of purchasing power. Your dollars buy less. Your savings lose value. The government’s obligations become more manageable. All without anyone having to cast a politically painful vote. The playbook hasn’t changed, yet the math just keeps getting worse. And I’m not going to stop saying this next part. When the currency is being debased, you want to own things that can’t be printed, inflated away, and don’t depend on a government’s promise to hold their value. Gold has played that role for thousands of years. Bitcoin was designed for exactly this scenario. A fixed supply of 21 million coins that no congress, central bank, or emergency spending bill can ever change. Again, I want to be clear on this. I’m not predicting the dollar collapses tomorrow. The US still has enormous advantages. The deepest capital markets in the world. The global reserve currency. A military that backs it all up. But the trajectory is clear. The deficit is structural. The interest is compounding. The growth is slowing. And every projection says it’s getting worse, not better. And so, a hearty congratulations to the US of A. Welcome to the 6% Club. It appears we will be here for a long, long, long, long time. Protect your purchasing power accordingly. That’s it. I hope you feel a little bit smarter knowing about the deficit-to-GDP ratio, the 6% Club, the doom loop, and why currency debasement remains the only door that ever opens. If you enjoyed this piece, please share it with someone who needs to see these numbers. Forward the email. Post the link. The more people who understand this math, the better positioned they’ll be. As always, feel free to reach out with questions, comments, or ideas for future topics. Talk soon, James✌️ Whether you agree with every conclusion or not, the underlying math is difficult to ignore. As dentists and small business owners, we operate in the real economy — where rising input costs, insurance pressures, and long-term planning are very real. Understanding the broader fiscal backdrop helps us make better decisions about how we store value and protect purchasing power. As always, I welcome your thoughts; pushback included. Just hit reply. And if you’d like more curated resources on sound money, bitcoin adoption in dental practices, and macro insights that matter to professionals like us, visit The Bitcoin Dental Network The more we understand the rules of the game, the better we can play it. Mark |


The Bitcoin Dental Network
I’m a restorative dentist who got a hard wake-up call during the 2008 financial crisis. Since then, I’ve poured thousands of hours into understanding money, risk, and why costs keep rising in healthcare. I share the most useful, actionable resources I’ve found—especially for dentists, but helpful to anyone—so you can protect your financial health and your practice. That’s why I built The Bitcoin Dental Network. It’s free, practical, and no strings attached.
Hello Reader, Many of you have already heard me talk about the financial “baptism by fire” Jean and I went through in 2008, when the monetary system suddenly stopped feeling abstract and became very personal. That experience is a big part of why articles like this one from Jordi Visser still grab my attention today. In this week’s Article of the Week, Jordi lays out a compelling framework for understanding the economic pressures building beneath the surface—debt, oil, slowing growth, and...
Hello Reader, There is, in my opinion, a nauseating amount of attention paid to Bitcoin’s price. And honestly, it’s hard to get away from it. Whether it’s pundits explaining the latest dump, perma-bulls calling for million-dollar Bitcoin, theories about Jane Street manipulation, chatter about ETFs and treasury companies “pumping our bags,” or endless arguments about the four-year cycle, the noise is constant. And it is noise. Inside and outside the Bitcoin world, many have lost sight of...
Hello Reader, Many of you read Sunday’s Article of the Week on the growing risks inside the private credit market. If that piece gave you a sense that something beneath the surface isn’t quite right… this week’s Video of the Week will take that feeling and sharpen it into clarity. In this conversation, Tom Bilyeu walks through the structural parallels between today’s private credit system and the mechanics that led to the 2008 financial crisis; connecting dots in a way that’s both sobering...