I’m a restorative dentist who got a hard wake-up call during the 2008 financial crisis. Since then, I’ve poured thousands of hours into understanding money, risk, and why costs keep rising in healthcare. I share the most useful, actionable resources I’ve found—especially for dentists, but helpful to anyone—so you can protect your financial health and your practice. That’s why I built The Bitcoin Dental Network. It’s free, practical, and no strings attached.
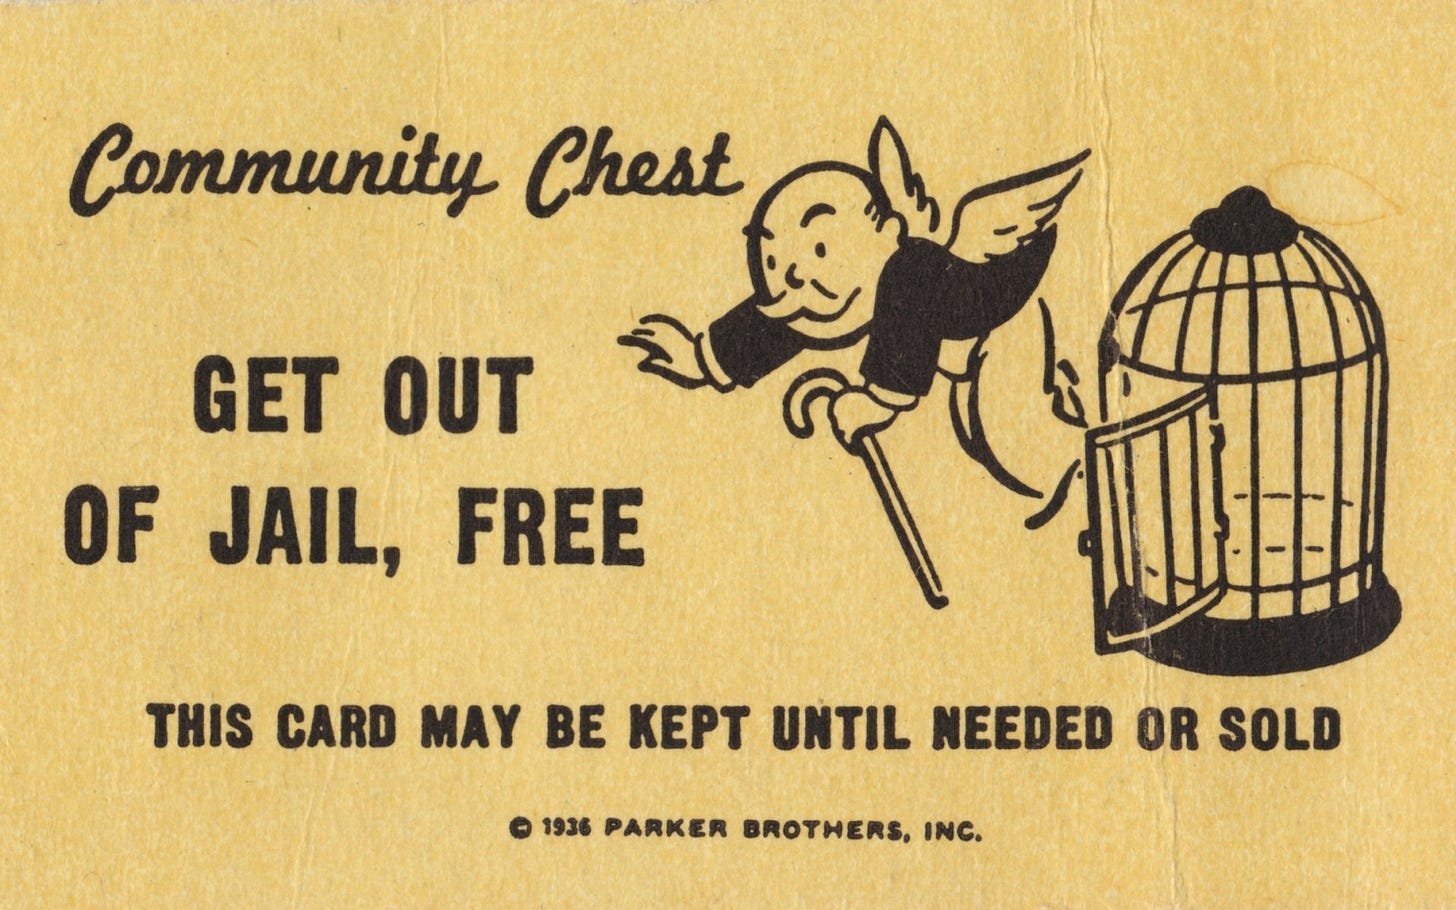
If you play "The Game" it's important to know the rules
|
Hello Reader, Many of you may feel like I’ve become a bit of a broken record—but if something is repeated this often, it’s because it matters that much. The more I study our monetary system, the more I realize how shocking the rules of the “game” really are. And whether you’re aware of it or not (and I’m trying to change that), understanding those rules is essential if you want to maintain any sense of financial autonomy. At the end of the day, every human being craves freedom. I created The Bitcoin Dental Network to curate the best resources I can find—so that my colleagues in dentistry can understand the game we’re all already playing, and learn how to play it well, instead of being quietly played by it. Is that overstating the proposition? Today’s Bullets:
Inspirational Tweet:
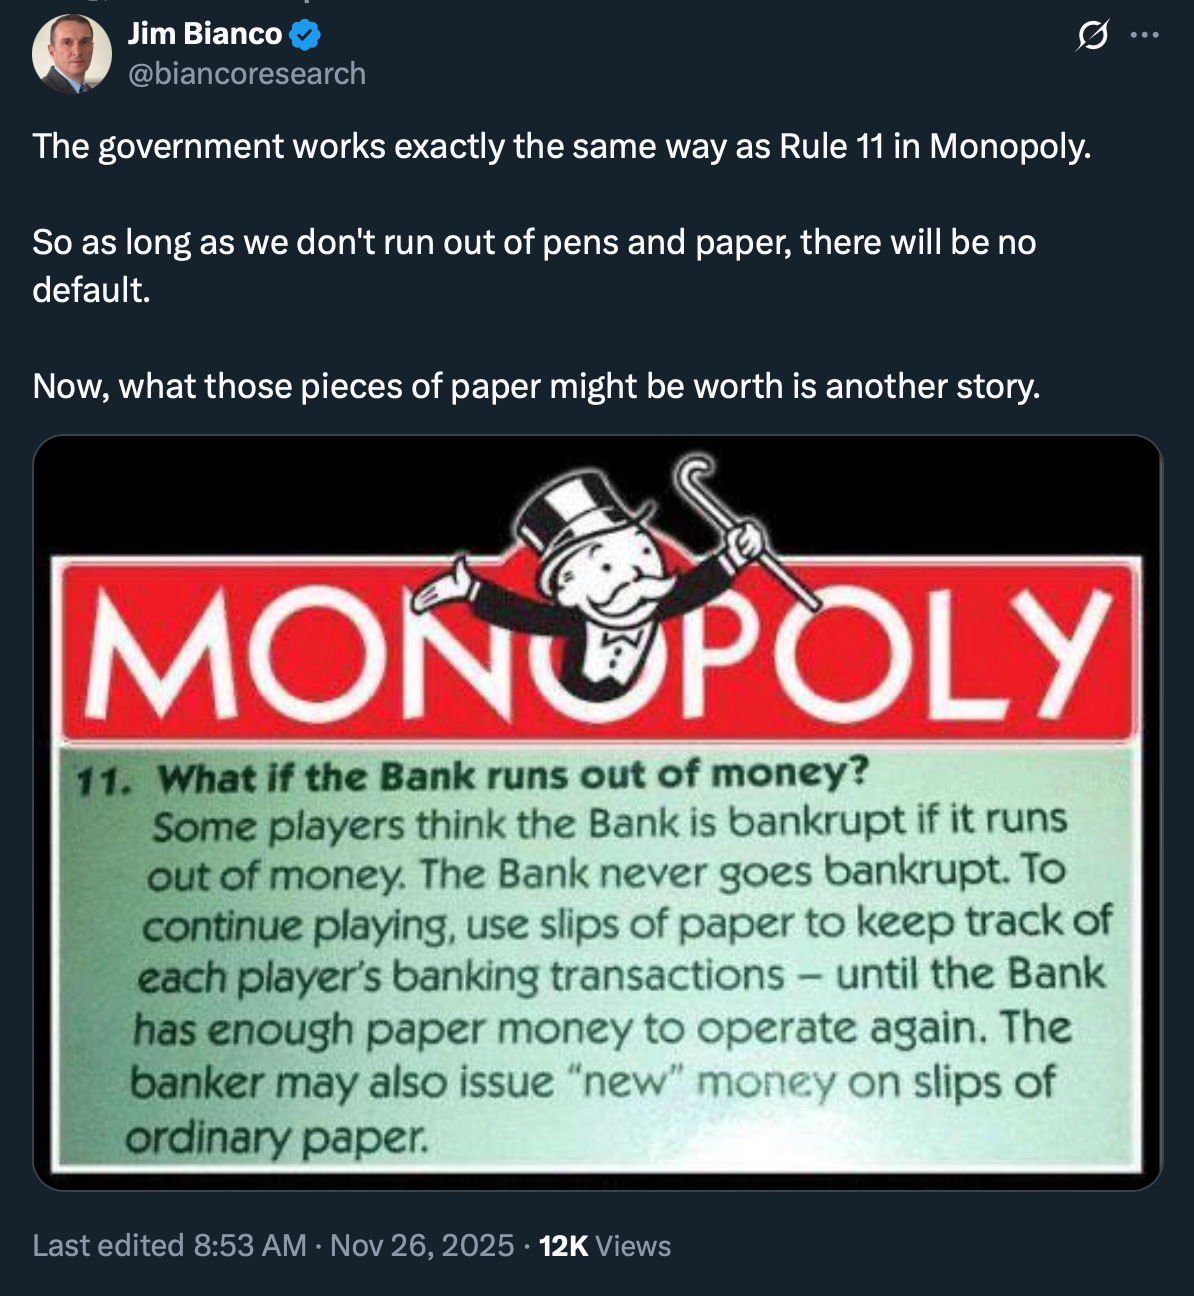
The government works exactly the same way as Rule 11 in Monopoly. So as long as we don’t run out of pens and paper, there will be no default. Not too far off the truth, there, Jim. I mean, there’s been an undeniable frustration about the rich are getting richer and overall sentiment that no matter what most people do, they simply can’t keep up anymore. But is the system really that broken? Is the game truly rigged? Well, let’s put it this way: if Monopoly were designed by the Fed today, the banker would start with a money printer, the rules would be a few thousand pages long and too convoluted for any of the players to understand, and the guy who owns Boardwalk and Park Place would also be on the committee that decides when to print more cash. Rigged would be an understatement. But what exactly does this mean for you and me? How does this affect your savings, your investments, your own ability to build wealth? And why does it seem like no matter how much you earn, you’re always running just to stay in place? All good questions, and ones we will answer, nice and easy as always, here today. So, pour yourself a big cup of coffee, and settle into your favorite seat for a realistic look at the lopsided financial game we’re all playing with this Sunday’s Informationist. 🎩 Rule 11: The Bank Never Runs Out of MoneyLet’s start with Monopoly Rule 11, shall we? “What if the Bank runs out of money? Some players think the Bank is bankrupt if it runs out of money. The Bank never goes bankrupt. To continue playing, use slips of paper to keep track of each player’s banking transactions—until the Bank has enough paper money to operate again. The banker may also issue ‘new’ money on slips of ordinary paper.” Read that again. Carefully. In essence, what it is saying is that the bank can literally write IOUs on scraps of paper and call it money. The game continues. The bank has an endless supply.
Try this with the IRS—sending scribbled IOUs to cover your annual tax bill—and you’ll be arrested.
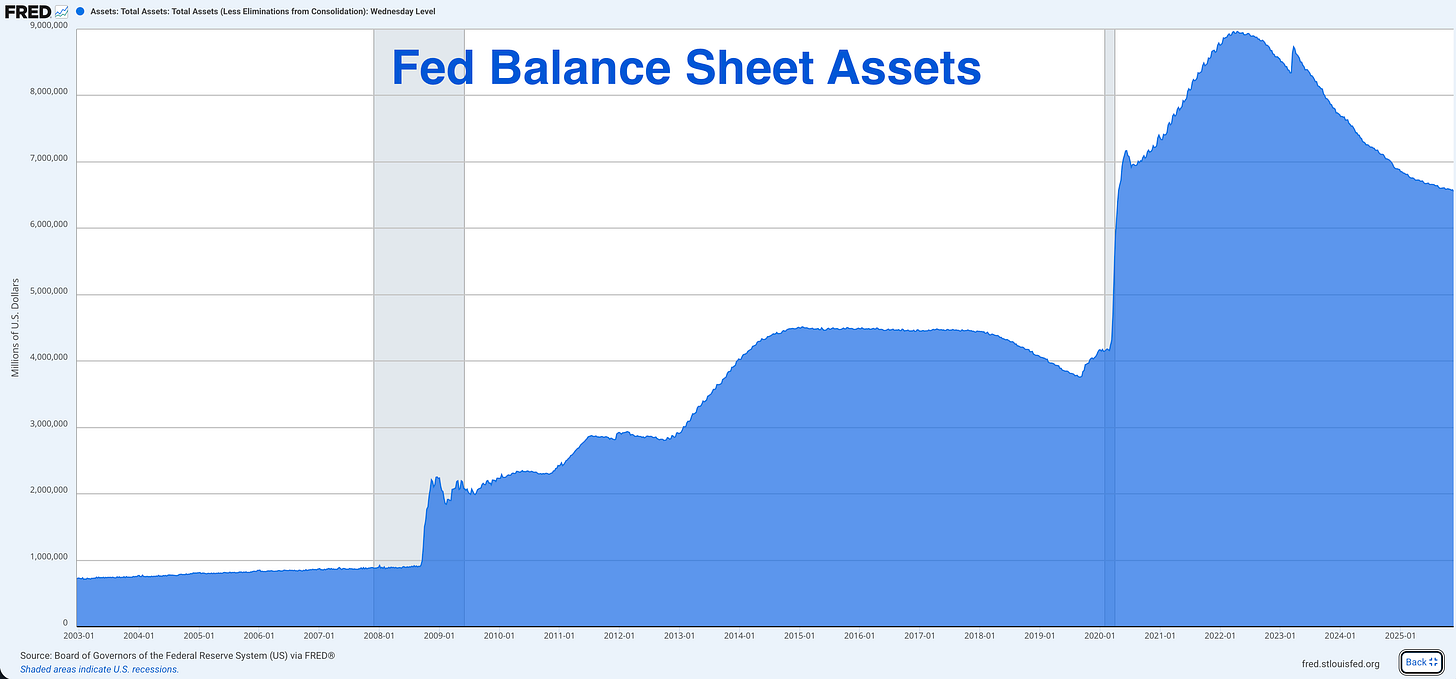
But when the Federal Reserve does it? They call it “monetary policy” and brag about its merits at their world-class boondoggle in Jackson Hole. To get an idea just how often they do this at the Fed, here’s a nifty little chart:
Before 2008, the Fed’s balance sheet was around $900 billion | 9,828,761 BTC. That’s where it had been, more or less, for decades. The Fed held Treasury securities, conducted normal monetary operations, and generally stayed out of the spotlight. Then came the Great Financial Crisis. Suddenly, the Fed used their own version of Monopoly Rule 11. Between late 2008 and 2014, they launched three rounds of “quantitative easing”—QE1, QE2, and QE3. By the time QE3 wrapped up, the balance sheet had ballooned to $4.5 trillion | 49,143,806 BTC. That’s a 5X increase. In six years. You can see it in the middle of the chart above, a long hump like the back of a dragon. Pretty severe, you think. Then COVID hit in 2020, the Fed went into hyperdrive. In just two years, they added another $4.8 trillion | 52,420,059 BTC to the system, making a total of $9 trillion | 98,287,611 BTC by early 2022. That’s the right side of the chart, the part that looks like a dragon’s head. Let’s put that in perspective. The Fed printed more money between March 2020 and March 2022 than it had in its entire 106-year history before 2008. $9 trillion | 98,287,611 BTC. Created from nothing. With the push of a button. If you’re new around here, you may be asking, how does this work mechanically? Simple. The Treasury issues bonds—IOUs from the government. The Fed buys those bonds, mainly through primary dealers (fancy Wall Street banks who get first dibs, like JP Morgan, Goldman Sachs, and Wells Fargo). The Big Boys. But here’s the thing. When the Fed “buys” these bonds, it doesn’t pay with money it has saved up. It credits the seller’s account with brand new dollars that didn’t exist five minutes ago. The Treasury gets cash to spend. The Fed gets bonds. And the money supply grows. It’s Rule 11 with a few extra steps and fancier vocabulary. The Fed will insist this isn’t “money printing.” They prefer terms like “asset purchases” or “balance sheet expansion” or my personal favorite, “providing necessary liquidity to ensure smooth functioning of financial markets.”
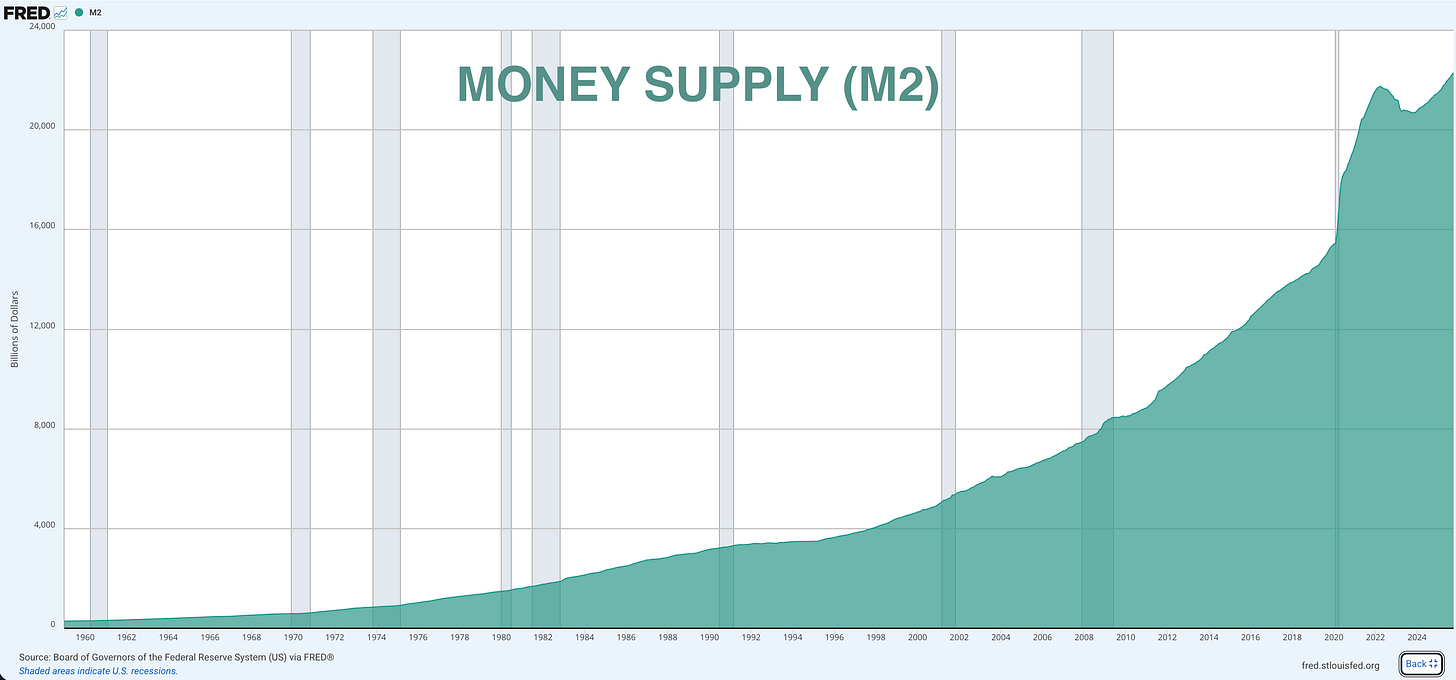
Please. You know what else ensures smooth functioning? Actual solvency. Anyway, the point is, the bank cannot go bankrupt. It creates the very dollars it uses to settle its obligations. Just like in Monopoly, the game continues no matter how many slips of paper they need to write. And Jerome Powell, bless his heart 🖤, will stand at the podium and tell the world with a straight face that the Fed has the “tools” to manage inflation. While they, of course, are the ones creating it. The arsonist with the firehose. 🤡🔥 🔄 The Closed Loop ProblemOK, so the bank can print unlimited money. Big deal, right? Money is just paper anyway. The whole world runs on IOUs, right? This is the classic argument of Modern Monetary Theory (MMT): We all owe each other, so what’s the harm? Let’s go back to the Monopoly board to test this. How many properties are there? Twenty-eight. Mediterranean Avenue, Baltic, etc., all the way up to Boardwalk and Park Place. Four railroads. Two utilities. That’s it. The board is fixed. Finite. Nobody is building a 29th property mid-game. Now, imagine you keep adding money to the game—but the number of properties stays the same. What happens? The price of those properties goes up. Not because they got better. Not because demand increased. Not because someone added a pool to Marvin Gardens or another wing in Park Place. Simply because there’s more paper chasing the same assets. This is asset inflation in its purest form. And this, my friends, is exactly what has happened in the real economy. How? Look at this chart.
This is M2—the broadest measure of the money supply that the Fed publishes. It includes cash, checking accounts, savings accounts, money market funds—basically all the money sloshing around the system. In 1960, M2 was around $300 billion | 3,276,254 BTC. By 2000, it had grown to about $4.9 trillion | 53,512,144 BTC. By 2020, just before COVID, it was around $15 trillion | 163,812,686 BTC. Then *BOOM*, five years later, it is now over $22 trillion | 240,258,606 BTC. That’s roughly 70× more than in 1960 and close to 5× the level of 2000. But here are the hard questions nobody at the Fed seems to want to answer: Did we create 70X more land in America since 1960? 70X more beachfront property? 70X more companies worth owning? Did we build 4X more houses since 2000? 4X more productive businesses? Of course not. The supply of quality assets grows slowly—maybe 2-3% per year in a good economy. But the supply of money? That can grow 40% in two years if the Fed decides it’s necessary to support the economy. So you have a relatively fixed supply of desirable assets (real estate in good locations, shares of profitable companies, productive farmland, and hard moneys like gold and Bitcoin) being chased by an ever-expanding supply of dollars. What happens to prices? They go up. A lot.
I know, shocking. This is why your grandparents bought a house for half a box of Grape Nuts and an old dish towel that is now worth $900,000 | 9.83 BTC. And why the S&P 500 has gone from 100 in 1980 to over 6,800 today. It’s not complicated. It’s just math. Infinite paper chasing finite assets. The denominator grows. The value of each dollar shrinks. And asset prices, measured in those devalued dollars, go vertical. But here’s what should really make your blood boil: the Fed measures its “success” by keeping consumer inflation around 2%. They pat themselves on the back while prices continue to sneakily rise. Every. Single. Year. Meanwhile, after inflation spikes, asset prices—houses, stocks, everything you need to build wealth—have skyrocketed and, without a recession or depression, will never come back down. And some things, like insurance and groceries will never, ever, come back down. So if you’re already on the property ladder, already own stocks, already have assets... you look like a genius. Your net worth keeps climbing. But if you’re young, just starting out, trying to buy your first home or build a portfolio? You’re stuck on an earnings treadmill that only spins faster. So it makes sense that the Fed doesn’t count asset inflation in their official metrics. Convenient, isn’t it? 🚰 The Cantillon Effect (Or, Why the Game is Rigged)Now here’s where the game gets truly unfair. When the Fed prints new money under the their version of Rule 11 (aka Quantitative Easing or QE), where does that money go? Does it benefit all players equally? Of course not. Which brings us to Richard Cantillon—an Irish-French economist who figured this out nearly 300 years ago. His insight was simple but profound: He found that when new money is created, those who get it first benefit the most. I.e., whoever is closest to the money spigot wins. This is called the Cantillon Effect, and it explains more about wealth inequality than a thousand PhD economist academic papers on the economy. By the way, I’ve written a whole newsletter dedicated to the Cantillon Effect, and if you want a deeper dive on its history and how it works, you can find that right here:
James Lavish, CFA·May 12, 2024Read full story For today, let’s first see how this plays out on our Monopoly board.
Imagine you’re playing with three friends. Everyone started with the same $1,500 | 0.02 BTC. The game is competitive but fair. You all roll the dice, buy properties when you can, and compete on equal footing. Then, halfway through the game, the banker—let’s call him Jerry Powers—decides to invoke Rule 11 and he creates an extra $5,000 | 0.05 BTC. Does Jerry divide that $5,000 | 0.05 BTC equally among all players, giving everyone $1,250 | 0.01 BTC? Not exactly, no. Instead, Jerry uses that $5,000 | 0.05 BTC to buy assets from the player sitting next to him, let’s call him Morgan. Maybe Jerry buys some of Morgan’s excess Chance cards. Morgan now has $5,000 | 0.05 BTC in fresh cash that nobody else has. What does Morgan do? He goes shopping. Boardwalk? His now. Park Place? Done. All four railroads? Why not. And here’s the best part: Morgan is buying at today’s prices. The other players don’t even know new money exists yet. By the time that $5,000 | 0.05 BTC circulates around the table—maybe Morgan pays some rent to another player, who pays some to another—the board is quickly bought up. And now, with all that extra cash floating around, when properties do come up for sale, they trade at higher prices. The players who got the money last are trying to buy assets with dollars that purchase less than they did before. Morgan now owns half the board. Everyone else is a renter for the rest of the game. This is the Cantillon Effect. OK, so how does this actually work in the real economy? Is it truly the same? Let’s trace the money to see, shall we? The Real World VersionWhen the Fed conducts quantitative easing (QE), it doesn’t deposit cash into everyone’s checking account. The mechanics are more complex, but the effect is the same. Here’s the process:
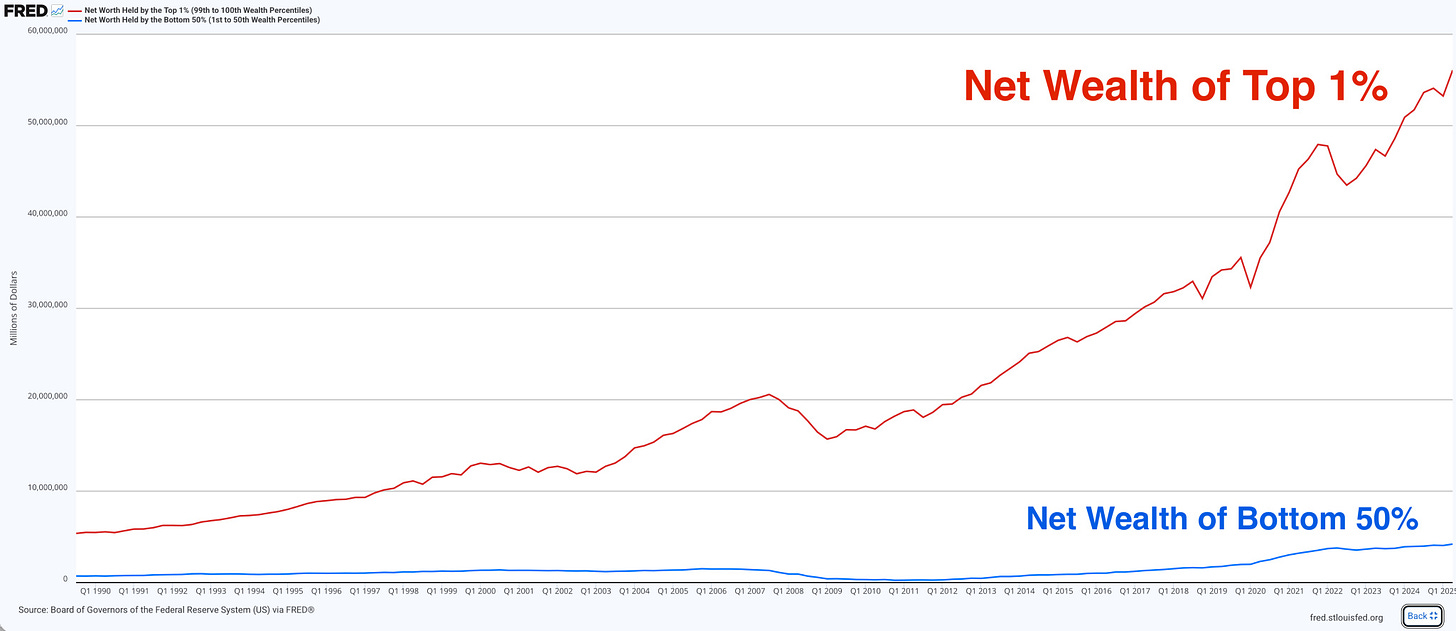
The people closest to the Fed—banks, hedge funds, institutional investors—get access to cheap money first. They buy assets at pre-inflation prices. Regular workers? They might see some wage gains a year or two later, after the cost of houses and stocks and everything else has already jumped. What the Data ShowsThis isn’t conspiracy theory. This isn’t speculation. The central banks themselves have admitted it. In 2012, the Bank of England published a report analyzing the effects of their £375 billion QE program. Their finding? The policy had benefited mainly the wealthy, with 40% of the gains going to the richest 5% of British households. Forty percent. To five percent. That’s not a bug. That’s how the system works. In 2013, Richard Fisher, President of the Dallas Fed, put it simply: “Cheap money has made rich people richer, but has not done quite as much for working Americans.” This is a Fed president. Saying this out loud. And nothing changed. Let’s look at the American data. According to the Federal Reserve’s own numbers, the wealthiest 10% of Americans now own 90% of all stocks. The bottom 50%? They own 1%. Read that again. Half of Americans, about 165 million people, collectively own 1% of the stock market. The top 10%, about 33 million people, own 90%. When the Fed prints money and stock prices rise, who benefits? The math is not complicated. Look at this chart:
This is Federal Reserve data showing the net worth of the top 1% (red line) versus the bottom 50% (blue line) since 1990. I went deeper on wealth separation recently, you can find that newsletter here:
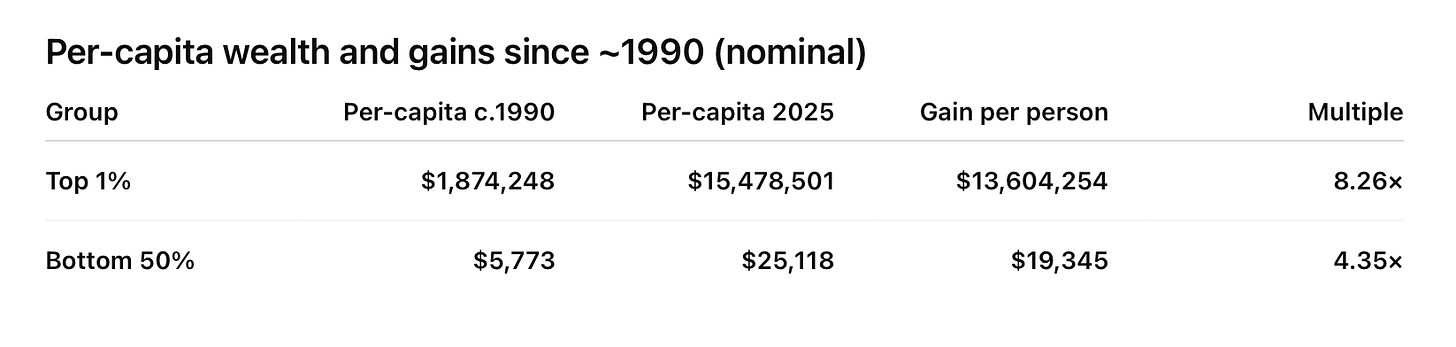
James Lavish, CFA·Sep 21Read full story For the TL;DR crowd: In 1990, the top 1% held about $5 trillion | 54,604,229 BTC in wealth. The bottom 50% held close to zero—maybe a few hundred billion. Today? The top 1% holds over $50 trillion | 546,042,286 BTC, and the bottom 50% has around $4 trillion | 43,683,383 BTC. Sounds like everyone made out, right? Now let’s do some math. The top 1% is approximately 3.3 million Americans. They hold $50 trillion | 546,042,286 BTC. That’s about $15.5 million | 169 BTC per person, on average. The bottom 50% is approximately 165 million Americans, maybe 65 million households. They hold $4 trillion | 43,683,383 BTC about $25K | 0.27 BTC per person. Ouch. But here’s what’s truly staggering: look at the gap over time. In 1990, the difference between these two groups was about $4 trillion | 43,683,383 BTC. Today, the difference is $47 trillion | 513,279,748 BTC. Look at the chart. The red line goes vertical starting around 2009. Remember what happened in 2009? Hint: it rhymes with ‘honey minter flows grrr’. Here’s what that means per person:
The average person in the top 1% gained $13.6 million | 149 BTC of wealth or 8.3x. And the average person in the bottom half gained roughly $19.3k | 0.21 BTC of ‘wealth’ or a 4.3x. Good Lord. The gap didn’t just grow. It exploded. And now you know why. Every single time the Fed expanded its balance sheet, asset prices rose. And every single time asset prices rose, the people who already owned assets got richer. The Fed didn’t create wealth. They redistributed it. From savers to borrowers. From wage earners to asset owners. From the middle class to the wealthy. And they did it with a straight face while telling us it was necessary to “support the economy.” 🏡 How to Win When the Rules Are Stacked Against YouSo where does that leave the rest of the people, non-one-percenters? Well, there’s one more Monopoly card worth mentioning:
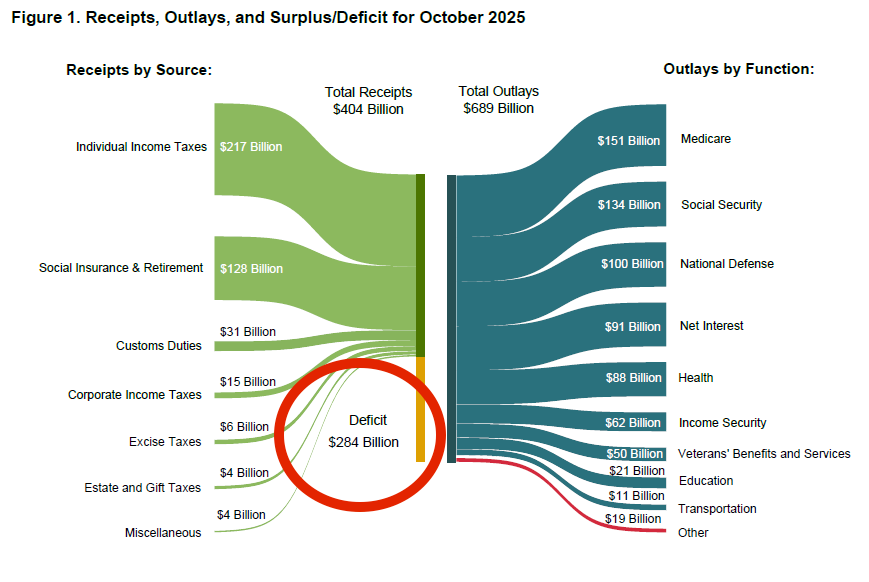
In the real economy, this card seems to be permanently held by Wall Street. Think about it: 1998: Long Term Capital Management, you know, that hedge fund that was run by genius Nobel Prize winners, imploded spectacularly. They made highly leveraged bets that went against them. In a normal world, they’d go bankrupt, investors would lose money, and everyone would learn a valuable lesson about risk. Instead? The New York Fed convened an emergency meeting with 14 major banks and orchestrated a $3.6 billion | 39,315 BTC bailout. Couldn’t let the geniuses actually face consequences, pf course. No. That might hurt the system. 2008: Bear Stearns makes terrible bets on mortgage-backed securities. They’re days from bankruptcy. In a normal world, they’d fail, shareholders would be wiped out, and the market would clear out the bad actors. Instead? The Fed engineers a rescue, providing $30 billion | 327,625 BTC in financing to help JP Morgan acquire Bear Stearns at a fire-sale price. Shareholders lost most of their money, but the creditors were protected. Remember the rule: We can’t let Wall Street face actual losses. Then Lehman Brothers collapsed anyway, the whole system nearly imploded, and what did we get? TARP. TALF. QE1. Emergency lending facilities. Trillions of dollars to rescue the banks that caused the crisis. 2020: A ‘Covid lock down’ shuts down the economy. The stock market crashes 34% in a month. Corporate bond markets freeze up. In a normal world, this would be a painful recession that clears out over-leveraged companies and resets valuations. Instead? The Fed goes nuclear. Zero interest rates. $120 billion | 1,310,501 BTC per month in asset purchases. Special facilities to buy corporate bonds, including junk bonds, directly. They literally started buying ETFs. The S&P 500 bottomed in March, 2020 and proceeded to nearly double over the next two years. You see the pattern? When regular people face financial hardship, we get lectures about Starbucks coffees and Netflix subscriptions. When Wall Street faces financial hardship, the Fed fires up the printing press. The big banks have a permanent Get Out of Jail Free card. When they win, they keep the profits. When they lose, the Fed prints money to cover their losses, and the rest of us simply pay through inflation and diminished purchasing power. This is not conjecture. It is fact. The Deficit RealityAnd it’s not like the government is showing any fiscal restraint to offset the Fed’s money creation.
Look at this chart from the Treasury showing October 2025 receipts and outlays. The government took in $404 billion | 4,412,022 BTC and spent $689 billion | 7,524,463 BTC. That’s a $284 billion | 3,101,520 BTC deficit. In a single month. And where does the money to cover a $284 billion | 3,101,520 BTC monthly gap come from? More borrowing. More Treasury issuance. More bonds for the Fed to eventually buy. More Rule 11. The debt math is simple: We can’t cut spending enough to balance the budget (look at the items above, carefully). We can’t raise taxes enough to cover the gap (economically destructive). So we’ll borrow, and eventually the Fed will monetize that borrowing by printing money to buy the bonds. Like I have been saying for years and keep saying, this isn’t speculation. It’s just math. The Only Winning MoveSo what can you do when you’re playing a game where:
You stop playing by their rules. In Monopoly, the winning strategy isn’t to hoard cash. It’s to own Boardwalk, Park Place or the railroads. It’s to own assets that generate income while your opponents pay you rent. Cash is for making transactions. Assets are for building wealth. The real economy works the same way. Remember:
This isn’t going to change. The Fed is trapped. The deficits are structural. The debt is too large to pay back in real terms. I repeat: countries that borrow in their own currency don’t default. They don’t miss payments. They don’t declare bankruptcy. They devalue their currency instead. They print money, pay back their debts with depreciated currency, and let inflation do the dirty work of reducing the real burden. The US has a lot of devaluing ahead. What To OwnSo, if you’re like me, you won’t waste energy fighting the Fed or complaining about the unfairness of the system. Waste of time and energy. Instead, you’ll simply position accordingly. Own assets that can’t be devalued: Real estate. They’re not making more land. Especially not in desirable locations. Yes, property prices are high. They’re likely going higher—measured in dollars, anyway. Gold. The original hard money. It’s been a store of value for 5,000 years. Central banks have been buying it with both fists lately, which tells you something. Bitcoin. The new hard money. Fixed supply of 21 million coins. No Fed chair can decide to print more. Math and physics, not politics and committees. The common thread? Scarcity. When the bank can print infinite paper, you want to own things that can’t be created by the press of a button. Again, this isn’t about getting rich quick. It’s about not getting poor slowly. The systematic transfer of wealth from savers to asset owners, from the many to the few, facilitated by money printing and the Cantillon Effect, is not going to stop. The rules of the game aren’t going to change. The people who benefit from these rules are the same people who write them. But you can change how you play. Own the properties. Own the railroads. Own Boardwalk. Because in the real world version of Monopoly, the bank has an unlimited supply of paper and ink. And the only players who win are those who buy limited assets being chased by all that new money. That’s it. I hope you feel a little bit smarter knowing about how the monetary game works, where the money goes, and how you can position yourself to come out ahead. If you enjoy The Informationist and find it helpful, please share it with someone who you think will love it, too! Talk soon, James As always, remember that The Bitcoin Dental Network is a completely free, curated resource built for one purpose: Specifically, everything I share aims to help you:
Your feedback genuinely matters. Reply and let me know: I refine this resource based on what you need. To your financial freedom, |


The Bitcoin Dental Network
I’m a restorative dentist who got a hard wake-up call during the 2008 financial crisis. Since then, I’ve poured thousands of hours into understanding money, risk, and why costs keep rising in healthcare. I share the most useful, actionable resources I’ve found—especially for dentists, but helpful to anyone—so you can protect your financial health and your practice. That’s why I built The Bitcoin Dental Network. It’s free, practical, and no strings attached.

Hello Reader, Last week’s sharp selloff in Bitcoin, gold, and silver caught many investors off guard, but moves like this are not unusual, especially in Bitcoin’s history. What is unusual is how little most retail investors understand about what actually causes them. In this week’s article, James Lavish explains the mechanics behind the drawdown, ETF flows, derivatives, leverage, and institutional “basis trades”, and why short-term price declines often have far more to do with market...
Hello Reader, Last week’s sharp selloff in Bitcoin, gold, and silver caught many investors off guard, but moves like this are not unusual, especially in Bitcoin’s history. What is unusual is how little most retail investors understand about what actually causes them. In this week’s article, James Lavish explains the mechanics behind the drawdown, ETF flows, derivatives, leverage, and institutional “basis trades”, and why short-term price declines often have far more to do with market...
Hello Reader, Most of us spent years in school learning how to care for patients and run practices, but almost none of us were ever taught how the monetary system we work inside of actually functions. That’s not a failure on anyone’s part. It’s just a gap in standard education. I came across a long-form video this week that does a surprisingly clear job explaining: How the modern money system has worked since the early 1970s Why inflation, debt, and periodic “resets” aren’t random And, most...